Posey's Tips & Tricks
DIY Network Monitoring for Hyper-V, Part 2
A PowerShell-based Hyper-V health monitor can give admins a quick, color-coded view of host, VM, replication, disk and memory issues before they become larger problems.
In the first part of this series, I talked about the problem that led me to build a PowerShell script that can be used to keep an eye on Hyper-V. In this blog post, I want to show you what it looks like when my script runs. From there, I will talk about the setup process and I will show you the code.
Before I show you what my script looks like when it runs, I need to give you a bit of background. My two production Hyper-V servers are named Prod1 and Prod2. The Prod1 server contains three running virtual machines that are replicated to Prod2. These VMs are named BDC, Mirage, and SQL. Prod2 contains one running virtual machine named PS-Apps that I am replicating to Prod1. The PS-Apps VM is resource intensive, so I run it on a separate host.
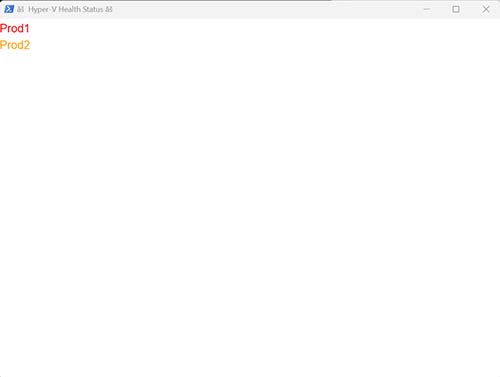
So with that said, you can see my script in Figure 1. At first glance, this script looks really unimpressive. It simply lists the name of my Hyper-V hosts. However, the important part is that the display is color coded. Prod1 is listed in red, meaning that something on Prod1 has failed. Prod2 is listed in orange, indicating that there is a warning for something on the Prod2 server.
 [Click on image for larger view.]
Figure 1. My script lists the names of my Hyper-V servers.
[Click on image for larger view.]
Figure 1. My script lists the names of my Hyper-V servers.
You can get more information about these conditions by clicking on a server name. Since Prod1 is shown in red, I will click on that server first to see what is going on. Doing so displays the screen shown in Figure 2.
 [Click on image for larger view.]
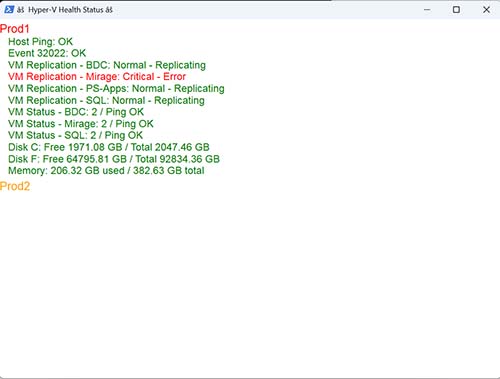
Figure 2. The PowerShell script provides summary information for the Prod1 server.
[Click on image for larger view.]
Figure 2. The PowerShell script provides summary information for the Prod1 server.
As you can see in the figure, clicking on the Prod1 server causes the script to display a health report for that server. First, the script confirms that PowerShell is able to ping the host and that Event 32022 has not occurred recently (this is the event number associated with a Hyper-V replication failure).
The script also lists the replication status for my virtual machines. Here you can see that three of my virtual machines are replicating normally, but there is a critical error associated with the virtual machine named Mirage.
Beneath the replication information, we can see the Ping status for all of the virtual machines that are running on the host. Finally, the script shows how much of the server’s disk space and memory are currently being used.
Clicking on Prod2 shows similar information, but for the Prod2 server. You can see what this looks like in Figure 3. You will notice that on Prod2, the server Mirage is shown as having a warning condition, not an error. The reason for this is that the Mirage VM contains a lot of data and therefore takes a long time to complete the initial replication process. Prod2 indicates that Hyper-V is waiting for the initial replication. Prod1 shows an error for the same virtual server because it does not yet have a full replica.
 [Click on image for larger view.]
Figure 3. Information shown from the Prod2 server.
[Click on image for larger view.]
Figure 3. Information shown from the Prod2 server.
OK, so let's get into the setup process. The beginning of the script contains this block of code:
# --- Configuration ---
$HyperVHosts = @("Prod1","Prod2")

  $VmHostMap = @{

  "Prod1" = @("BDC","Mirage",  "SQL")

  "Prod2" = @("PS-Apps")

  }

  $PingTimeoutMs = 2000 # milliseconds
# --- Credential prompt ---
$Cred = Import-Clixml C:\HealthCheck\hvcred.xml
This block of code is where I defined the names of my Hyper-V hosts and the names of the VMs on each host. This section of code also sets the length of a Ping timeout (when a ping is considered to have failed). Finally, this block of code is also where I read the credential file.
There are three other configuration items buried deep within the code. The first is in the Event 32022 section, which checks for Hyper-V replication failures. I did not want the code to check to see if Event 32022 had ever been logged in the past, because doing so could have caused an old event to be interpreted as an error condition. That being the case, I designed the code to look for errors that have been logged within the last ten minutes (StartTime = (Get-Date).AddMinutes(-10)). You can see the 10 minute option in the excerpt below:
# --- Event 32022 ---

  Try {

  $Events =  Invoke-Command -ComputerName $HyperVHost -Credential $Cred -ScriptBlock {

  Get-WinEvent -FilterHashtable @{

  LogName  = 'Microsoft-Windows-Hyper-V-VMMS-Admin'

  Id =  32022

  StartTime = (Get-Date).AddMinutes(-10)

  }  -ErrorAction SilentlyContinue  # <-  suppress non-terminating errors

  }
Another configuration item comes into play with regard to the disk checks. I designed my script to display the disk space in red if there is less than 100 GB of space ($Color = If ($FreeGB -lt 100) {"Red"}) available on the disk. You can see this setting in the excerpt below:
# --- Disk Checks ---

  Try {

  $Disks =  Invoke-Command -ComputerName $HyperVHost -Credential $Cred -ScriptBlock {

  Get-PSDrive -PSProvider 'FileSystem' | Select-Object Name, Free, Used,  @{Name="TotalGB";Expression={[math]::Round($_.Used/1GB +  $_.Free/1GB,2)}}

  }

  ForEach  ($Disk In $Disks) {

  $FreeGB  = [math]::Round($Disk.Free/1GB,2)

  $Color  = If ($FreeGB -lt 100) {"Red"} Else {"Green"}

  If  ($Color -eq "Red") { $HostProblemsDetected = $True }

  $HostReport["Details"] += @{Text="Disk $($Disk.Name):  Free $FreeGB GB / Total $($Disk.TotalGB) GB"; Color=$Color}

  }

  } Catch {

  $HostReport["Details"] += @{Text="Disk Check: ERROR -  $_"; Color="Red"}

  $HostProblemsDetected = $True

  }
The last configuration item is found in the Memory Check section ($Color = If (($UsedGB/$TotalGB) -gt 0.9) {"Red"} Else {"Green"}). This check causes the memory usage to be display in red if more than 90 percent of the server's memory is in use.
   # --- Memory  Check ---

  Try {

  $Memory =  Invoke-Command -ComputerName $HyperVHost -Credential $Cred -ScriptBlock {

  Get-CimInstance Win32_OperatingSystem | Select-Object  TotalVisibleMemorySize, FreePhysicalMemory

  }

  $UsedGB =  [math]::Round(($Memory.TotalVisibleMemorySize -  $Memory.FreePhysicalMemory)/1MB,2)

  $TotalGB =  [math]::Round($Memory.TotalVisibleMemorySize/1MB,2)

  $Color = If  (($UsedGB/$TotalGB) -gt 0.9) {"Red"} Else {"Green"}

  If ($Color  -eq "Red") { $HostProblemsDetected = $True }

  $HostReport["Details"] += @{Text="Memory: $UsedGB GB used  / $TotalGB GB total"; Color=$Color}

  } Catch {

  $HostReport["Details"] += @{Text="Memory Check: ERROR -  $_"; Color="Red"}

  $HostProblemsDetected = $True

}
So now that I have talked about the configuration options that exist within the code, here is the script in its entirety:
param(

  [ValidateSet("Daily","Hourly")]

  [string]$Mode =  "Daily"

  )

Add-Type -AssemblyName PresentationFramework
# --- Configuration ---
$HyperVHosts = @("Prod1","Prod2")

  $VmHostMap = @{

  "Prod1" = @("BDC","Mirage",  "SQL")

  "Prod2" = @("PS-Apps")

  }

  $PingTimeoutMs = 2000 # milliseconds

  $ShowDailyStatus = ($Mode -eq "Daily")
# --- Credential prompt ---
$Cred = Import-Clixml C:\HealthCheck\hvcred.xml
# --- Custom Ping function compatible with PS 5.1 ---

  Function Test-Ping {

  Param (

  [Parameter(Mandatory)]

  [string]$ComputerName,
         [int]$TimeoutMs = 2000

  )
    Try {

  $Ping =  New-Object System.Net.NetworkInformation.Ping

  $Reply =  $Ping.Send($ComputerName, $TimeoutMs)

  If  ($Reply.Status -eq "Success") { return $True } else { return $False }

  } Catch {

  return  $False

  }

  }
# --- Initialize ---

  $AllHostReports = @()

  $OverallProblemsDetected = $False
# --- Function to determine worst status color ---

  Function Get-StatusColor($Statuses) {

  If ($Statuses  -contains "Red") { return "Red" }

  ElseIf  ($Statuses -contains "Orange") { return "Orange" }

  Else { return  "Green" }

  }
# --- Collect Data for Each Host ---

  ForEach ($HyperVHost In $HyperVHosts) {
    $HostReport =  [ordered]@{}

  $HostReport["SummaryText"] = "$HyperVHost"

  $HostReport["Details"] = @()

  $HostProblemsDetected = $False
    # --- Host Ping  ---

  If (Test-Ping  -ComputerName $HyperVHost -TimeoutMs $PingTimeoutMs) {

  $HostReport["Details"] += @{Text="Host Ping: OK";  Color="Green"}

  } Else {

  $HostReport["Details"] += @{Text="Host Ping:  FAILED"; Color="Red"}

  $HostProblemsDetected = $True

  }
    # --- Event  32022 ---

  Try {

  $Events =  Invoke-Command -ComputerName $HyperVHost -Credential $Cred -ScriptBlock {

  Get-WinEvent -FilterHashtable @{

  LogName  = 'Microsoft-Windows-Hyper-V-VMMS-Admin'

  Id =  32022

  StartTime = (Get-Date).AddMinutes(-10)

  }  -ErrorAction SilentlyContinue  # <-  suppress non-terminating errors

  }
    If  ($Events.Count -gt 0) {

  $HostReport["Details"] += @{Text="Event 32022:  DETECTED"; Color="Red"}

  $HostProblemsDetected = $True

  } Else {

  $HostReport["Details"] += @{Text="Event 32022: OK";  Color="Green"}

  }

  } Catch {

  $HostReport["Details"] += @{Text="Event 32022: ERROR -  $_"; Color="Red"}

  $HostProblemsDetected = $True

  }
    # --- VM  Replication Health (all VMs) ---
    $Replications =  Invoke-Command -ComputerName $HyperVHost -Credential $Cred -ScriptBlock {

  Get-VMReplication | Select-Object VMName, ReplicationHealth,  ReplicationState

  }

  ForEach ($Rep In $Replications) {

$Name = $Rep.VMName
$Health = $Rep.ReplicationHealth.ToString()
If ($Health -eq "Normal") {

  $HostProblemsDetected = $False

  $Color = "Green"

  }

  If ($Health -eq "Warning") {

  $HostProblemsDetected = $True

  $Color = "Orange"

  }

  If ($Health -eq "Critical") {

  $HostProblemsDetected = $True

  $Color = "Red"

  }
$State = $Rep.ReplicationState.ToString()

$Text = "VM Replication - $($Name): $($Health) -  $($State)"


     $HostReport["Details"] += @{

  Text =  $Text

  Color =  $Color

  }

  }

    # --- Assigned  VMs: Running state + ping ---

  $AssignedVMs =  $VmHostMap[$HyperVHost]

  Try {

  $VMs =  Invoke-Command -ComputerName $HyperVHost -Credential $Cred -ScriptBlock {

  Get-VM  | Select-Object Name, State

  }

  ForEach  ($VmName In $AssignedVMs) {

  $Vm =  $VMs | Where-Object {$_.Name -eq $VmName}

  If  ($Vm) {

  $VmPing = Test-Ping -ComputerName $Vm.Name -TimeoutMs $PingTimeoutMs

  $VmStatus = $Vm.State

  $PingText = if ($VmPing) { "OK" } else { "FAILED" }

  $Color = if ($VmPing) { "Green" } else { "Red" }

  If  ($Color -eq "Red") { $HostProblemsDetected = $True }

  $HostReport["Details"] += @{Text="VM Status - ${VmName}:  $VmStatus / Ping $PingText"; Color=$Color}

  } Else  {

  $HostReport["Details"] += @{Text="VM Status - ${VmName}:  NOT FOUND"; Color="Red"}

  $HostProblemsDetected = $True

  }

  }

  } Catch {

  $HostReport["Details"] += @{Text="VM Status Check: ERROR  - $_"; Color="Red"}

  $HostProblemsDetected = $True

  }
    # --- Disk  Checks ---

  Try {

  $Disks =  Invoke-Command -ComputerName $HyperVHost -Credential $Cred -ScriptBlock {

  Get-PSDrive -PSProvider 'FileSystem' | Select-Object Name, Free, Used,  @{Name="TotalGB";Expression={[math]::Round($_.Used/1GB +  $_.Free/1GB,2)}}

  }

  ForEach  ($Disk In $Disks) {

  $FreeGB  = [math]::Round($Disk.Free/1GB,2)

  $Color  = If ($FreeGB -lt 100) {"Red"} Else {"Green"}

  If  ($Color -eq "Red") { $HostProblemsDetected = $True }

  $HostReport["Details"] += @{Text="Disk $($Disk.Name):  Free $FreeGB GB / Total $($Disk.TotalGB) GB"; Color=$Color}

  }

  } Catch {

  $HostReport["Details"] += @{Text="Disk Check: ERROR -  $_"; Color="Red"}

  $HostProblemsDetected = $True

  }
    # --- Memory  Check ---

  Try {

  $Memory =  Invoke-Command -ComputerName $HyperVHost -Credential $Cred -ScriptBlock {

  Get-CimInstance Win32_OperatingSystem | Select-Object  TotalVisibleMemorySize, FreePhysicalMemory

  }

  $UsedGB =  [math]::Round(($Memory.TotalVisibleMemorySize -  $Memory.FreePhysicalMemory)/1MB,2)

  $TotalGB =  [math]::Round($Memory.TotalVisibleMemorySize/1MB,2)

  $Color = If  (($UsedGB/$TotalGB) -gt 0.9) {"Red"} Else {"Green"}

  If ($Color  -eq "Red") { $HostProblemsDetected = $True }

  $HostReport["Details"] += @{Text="Memory: $UsedGB GB used  / $TotalGB GB total"; Color=$Color}

  } Catch {

  $HostReport["Details"] += @{Text="Memory Check: ERROR -  $_"; Color="Red"}

  $HostProblemsDetected = $True

  }
    # --- Determine  summary color ---

  $HostReport["SummaryColor"] = Get-StatusColor  ($HostReport["Details"].Color)

  If  ($HostProblemsDetected) { $OverallProblemsDetected = $True }
    $AllHostReports  += $HostReport

  }
# --- Display WPF Popup ---

  If ($OverallProblemsDetected -or $ShowDailyStatus) {

  $Window =  New-Object System.Windows.Window

  $Window.Title =  "Hyper-V Health Status"

  $Window.Width =  800

  $Window.Height  = 600

  $Window.WindowStartupLocation = "CenterScreen"

  $Window.Topmost  = $True
    $StackPanel =  New-Object System.Windows.Controls.StackPanel
    ForEach  ($HostReport In $AllHostReports) {
        # Summary  line (entire line colored)

  $SummaryTextBlock = New-Object System.Windows.Controls.TextBlock

  $SummaryTextBlock.Text = $HostReport["SummaryText"]

  $SummaryTextBlock.FontFamily = "Arial"

  $SummaryTextBlock.FontSize = 18

  $SummaryTextBlock.Foreground =  ([System.Windows.Media.Brushes]::$($HostReport["SummaryColor"]))

  $SummaryTextBlock.Margin = "0,5,0,0"

  $StackPanel.Children.Add($SummaryTextBlock) | Out-Null
        #  Collapsible details

  $DetailsPanel = New-Object System.Windows.Controls.StackPanel

  $DetailsPanel.Visibility = "Collapsed"

  ForEach  ($Line In $HostReport["Details"]) {

  $TextBlock = New-Object System.Windows.Controls.TextBlock

  $TextBlock.Text = "   "  + $Line.Text

  $TextBlock.FontFamily = "Arial"

  $TextBlock.FontSize = 16

  $TextBlock.Foreground = ([System.Windows.Media.Brushes]::$($Line.Color))

  $DetailsPanel.Children.Add($TextBlock) | Out-Null

  }

  $StackPanel.Children.Add($DetailsPanel) | Out-Null
        # Click to  toggle

  $LocalDetailsPanel = $DetailsPanel
       $SummaryTextBlock.Tag = $DetailsPanel
       $SummaryTextBlock.Add_MouseLeftButtonDown({

  param($sender, $args)
         $panel =  $sender.Tag
         If  ($Panel.Visibility -eq "Collapsed") {

  $Panel.Visibility = "Visible"

  }

  Else {

  $Panel.Visibility = "Collapsed"

  }

  })

  }
    $ScrollViewer =  New-Object System.Windows.Controls.ScrollViewer

  $ScrollViewer.Content = $StackPanel

  $ScrollViewer.VerticalScrollBarVisibility = "Auto"
    $Window.Content  = $ScrollViewer

  $Window.ShowDialog() | Out-Null

  }
In Part 3 of this series, I will conclude the discussion by showing you how to build the event triggers that cause the script to be executed.
About the Author
Brien Posey is a 22-time Microsoft MVP with decades of IT experience. As a freelance writer, Posey has written thousands of articles and contributed to several dozen books on a wide variety of IT topics. Prior to going freelance, Posey was a CIO for a national chain of hospitals and health care facilities. He has also served as a network administrator for some of the country's largest insurance companies and for the Department of Defense at Fort Knox. In addition to his continued work in IT, Posey has spent the last several years actively training as a commercial scientist-astronaut candidate in preparation to fly on a mission to study polar mesospheric clouds from space. You can follow his spaceflight training on his Web site.