Posey's Tips & Tricks
Using Windows 10's Reliability Monitor To Track Down Potential Problems
Windows includes a built-in tool that can help you spot correlations between recent changes and current system problems. Here's how to use it.
Countless times, family and friends have asked me to identify an issue with their computers. While I don't mind giving them advice, asking them what is wrong often leads to them reciting an obscure error code that is completely meaningless. At that point, my next step is usually to ask them if they have made any changes to their computer recently. After all, if a problem begins shortly after a change was made, then that change is likely the source of the problem.
Of course, in the real world, things are rarely this simple. The person might not remember making a recent change. Similarly, an automated update could have made a change that the person doesn't even know about.
Thankfully, Windows includes a built-in tool called the Reliability Monitor that can help you spot correlations between recent changes and problems that are occurring on the system. You can access the Reliability Monitor through the Windows Control Panel. To do so, enter the Control command at the Windows Run prompt. When the Control Panel opens, click on System and Security, followed by Security and Maintenance. This will cause Windows to display the screen shown in Figure 1
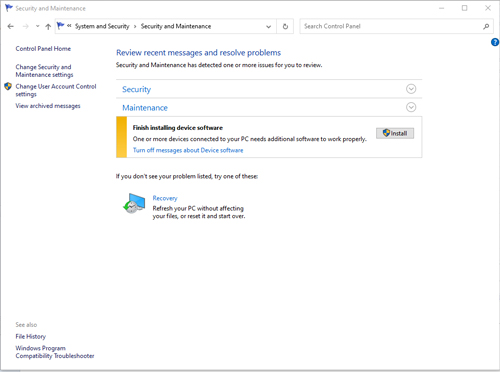 [Click on image for larger view.] Figure 1: This is Windows 10's Security and Maintenance screen.
As you look at the figure above, you will notice that the upper portion of the screen displays the words "Security" and "Maintenance" and that there are down arrows to the right of each. Click the down arrow next to Maintenance. This will cause Windows to reveal a plethora of maintenance options, as shown in Figure 2.
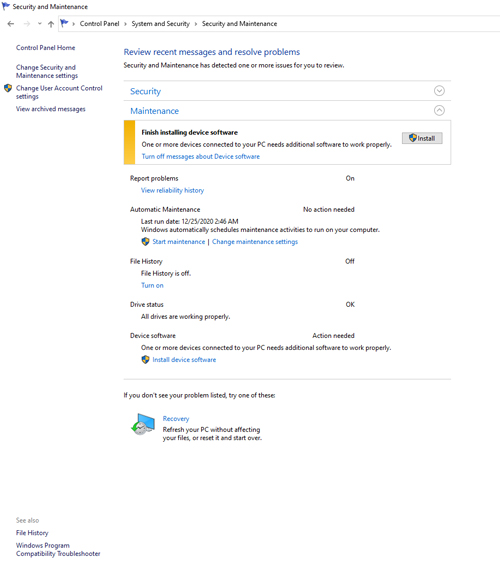 [Click on image for larger view.] Figure 2: Windows includes lots of different maintenance tools.
Now, click on the View Reliability History link, shown in the figure above. This will open the Reliability Monitor, which you can see in Figure 3.
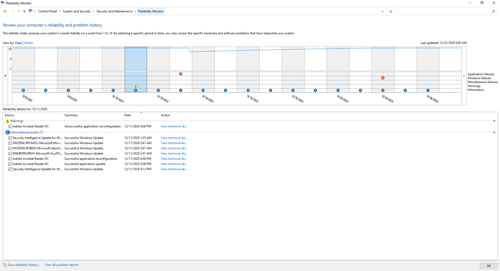 [Click on image for larger view.] Figure 3: This is what the Reliability Monitor looks like.
As you look at the screen capture above, you will notice that the Reliability Monitor is divided into several sections. Near the top are two links labeled Days and Weeks. You can use these links to filter the view. Just beneath the links. however, are the numbers 10, 5 and 1. You will also notice a horizontal blue line to the right of the number 10. This blue line is what I consider to be the most important feature, yet the easiest one to overlook.
The blue line represents the computer's reliability, rated on a scale from 1 to 10, with 10 being the most reliable. There are dates printed at the bottom of the chart that you can use to track how the system's reliability has changed over time. On Dec. 13, 2020, for example, there was a minor problem on my computer that caused the reliability score to take a dip. The computer's reliability gradually increased over time, however, as the system proved itself to be stable.
If your goal is to troubleshoot problems with a computer, a good way to start is by opening the Reliability Monitor and looking for sharp dips in the reliability score. Incidentally, there is an arrow icon to the left of the chart that you can use to look further back in time. The Daily view will let you look at the last 30 days, but you can use the Weeks view to go back further than that. Once you find an area that you want to examine in more detail, just click on the day or week and Windows will show you relevant information from the event logs.
One last point I want to mention is that errors are not the only thing that can impact a computer's reliability score. Major updates or configuration changes can also adversely impact the score until the computer has time to prove that the change did not introduce any problems.
Back in November, for example, I performed a major hardware upgrade on my primary desktop computer. That upgrade (and all of the related driver installations and configuration changes) caused my system's reliability score to take a big hit, even though no errors occurred. You can see what this looks like in Figure 4.
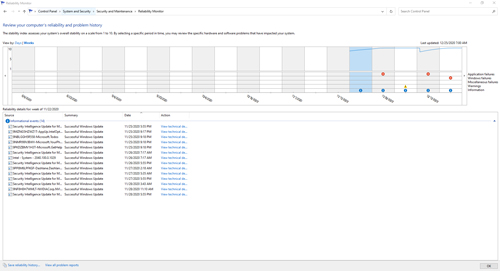 [Click on image for larger view.] Figure 4: The reliability score was impacted even though no errors occurred.
About the Author
Brien Posey is a 22-time Microsoft MVP with decades of IT experience. As a freelance writer, Posey has written thousands of articles and contributed to several dozen books on a wide variety of IT topics. Prior to going freelance, Posey was a CIO for a national chain of hospitals and health care facilities. He has also served as a network administrator for some of the country's largest insurance companies and for the Department of Defense at Fort Knox. In addition to his continued work in IT, Posey has spent the last several years actively training as a commercial scientist-astronaut candidate in preparation to fly on a mission to study polar mesospheric clouds from space. You can follow his spaceflight training on his Web site.