Posey's Tips & Tricks
Working with Excel's New Data Types
Microsoft has started to roll out a new feature that promises to turn Excel into a much more valuable data-surfacing tool than ever before. Here's how it works.
A few months ago, I wrote about the extensive work that Microsoft was doing around expanded data types for Excel. If you missed it, the idea is that Microsoft is building what I like to think of as data awareness into Excel. This will make it possible for Excel to provide additional information related to what was previously a static text field.
Excel is eventually going to recognize over 100 new data types. Microsoft has not yet said what all of those new data types will be, but it did confirm that one of the data types will be food. That means that if you were to type the word "pizza" into a cell, reference cells might be automatically populated with related statistics such as the calorie count or the number of carbs found in a slice of pizza.
The point is that when a user enters words into a spreadsheet, Excel will be able to check if the word corresponds to a known data type, and then provide supplementary data without the user having to manually acquire that data.
The reason I wanted to revisit this topic is that Microsoft has begun the update process that will enable Excel to work with new data types. In doing so, Microsoft has enabled Excel to now recognize data related to stocks and geography. As such, I wanted to show you how Excel's new data intelligence works.
Since one of the new data types is geography, I am going to open Excel and type the name of the state where I live (South Carolina). If you look at Figure 1, you can see that Excel does not initially do anything special with the words that I typed. They look exactly the same as any other text entry that you might type into Excel.
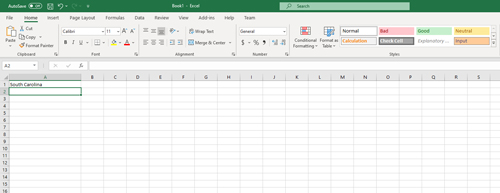 [Click on image for larger view.] Figure 1: Initially, Excel does not do anything special with the text that I have entered.
Right now, Excel sees the words "South Carolina" as raw text. To leverage Excel's new capabilities, we have to tell Excel to treat the cell as data rather than text. Fortunately, this is easier than it sounds.
To get Excel to treat text as a recognized data type, just select the cell (or cells if you have more than one cell to convert) and go to the Data tab. If you look at Figure 2, you can see that the Data tab's toolbar now contains a Data Types section. Right now, the only available data types are Stocks and Geography, but others will be added later. Simply click the data type that you want to use, and Excel should begin treating the selected cell's contents as data.
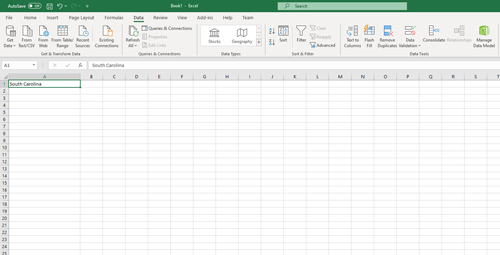 [Click on image for larger view.] Figure 2: The Data tab lists the new data types.
Some of you may be wondering why Microsoft chose to implement its new data types this way, as opposed to having Excel just automatically assign a data type based on a cell's contents. While I don't know the official answer to that question, I can think of a few reasons why automatic text recognition would be a bad idea:
- Suddenly and automatically applying data types to cells in older spreadsheets could produce unpredictable results.
- A cell's contents could be recognized as being something that it is not. For example, I have a close friend whose daughter is named Madison. If Excel automatically identified data types, Madison's name could be incorrectly identified as a city in Wisconsin, or perhaps as a historical figure.
- A piece of data could fall into multiple categories. I can think of a few publicly traded companies whose names could be mistaken for geographic places. If Excel encountered such an entry, it might be hard-pressed to figure out if it should be interpreted as being geography- or stock-related.
In any case, it's best to identify data types manually to prevent confusion.
So with that said, take a look at Figure 3. In this figure, you will notice a map icon just to the left of the words "South Carolina." This icon indicates that Excel is now treating the cell's contents as geographic data.
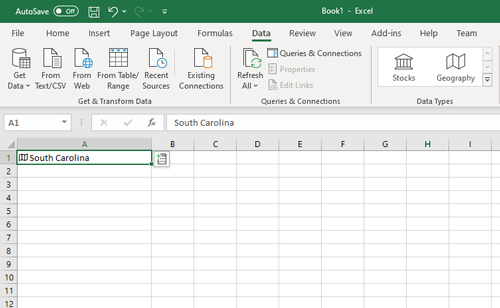 [Click on image for larger view.] Figure 3: The cell is now being treated as geographic data.
You will also notice that when the cell is selected, an Insert Data icon appears to the right of the data. When you click on this icon, Excel displays numerous fields that can be inserted into the next cell. These fields can be used to display anything from population statistics to the state flag. Just pick the statistic that you want to add and Excel does the rest, as shown in the figure below.
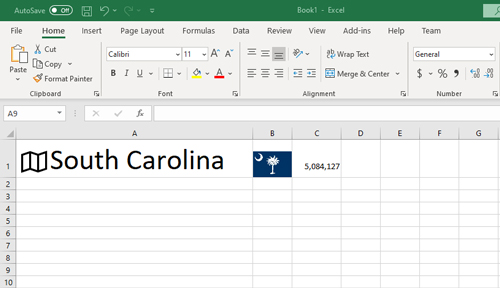 [Click on image for larger view.] Figure 4: Excel has provided the South Carolina state flag and the state's population.
About the Author
Brien Posey is a 22-time Microsoft MVP with decades of IT experience. As a freelance writer, Posey has written thousands of articles and contributed to several dozen books on a wide variety of IT topics. Prior to going freelance, Posey was a CIO for a national chain of hospitals and health care facilities. He has also served as a network administrator for some of the country's largest insurance companies and for the Department of Defense at Fort Knox. In addition to his continued work in IT, Posey has spent the last several years actively training as a commercial scientist-astronaut candidate in preparation to fly on a mission to study polar mesospheric clouds from space. You can follow his spaceflight training on his Web site.