In-Depth
First Look: Power BI 2.0
Microsoft pushes the envelope on self-service business intelligence with the first major upgrade of Power BI, equipped with data access tools that extend the limits of Excel and traditional data sources.
Self-service business intelligence (BI) continues to be a major desire for most organizations and Microsoft's updated Power BI continues to target that goal. The first major upgrade of Power BI since its initial release last year utilizes existing tools wrapped up in an all new package.
With the inaugural version of Power BI for Office 365, Excel was at the center driven by plug-ins. We had Power Pivot, Power Query, Power View and the excellent natural language Q&A. It was all great unless you weren't an Office 365 subscriber. Solution: Break Power BI out as a stand-alone product, set it up so companies not running the latest versions of Excel can still use Power BI, and offer an entry level service for free, which is what Microsoft has done with this upgrade, released today. And to top it off, you can setup Power BI so it does not need Excel. Now Power BI 2.0 enables and extends Excel, but Power BI's data access tools go beyond Excel and traditional data sources. It's offered either online at the Power BI portal or with the new 64 bit Power BI Desktop application.
Still, with Excel the dominant analytic tool, and SQL Server and Analysis Services holding a strong position in data management, do we really need yet another tool? Historically, Microsoft has struggled with the presentation side of business intelligence. Yes, there is SQL Server Reporting Services, but it's controlled by IT and takes a developer to make a useful report. SharePoint as well requires considerable setup, IT management and cost. It's great from a corporate control standpoint but a constraint for self-service BI for all.
Power BI 2.0 pulls in all of the excellent Excel plug-in technology and sets it free. This new release positions Power BI and Microsoft to be the major player in self-service BI. And perhaps a first step for companies to migrate to Office 365.
Online Portal
With Microsoft gently nudging users to migrate online to Office 365, it's not surprising that Power BI is a hosted, cloud service. As an analysis and reporting tool, Power BI covers the expected areas of dashboards, report building, data sourcing and organization. But as an online business intelligence service, Power BI is forced to bridge the divide between the online service and the reality that at least for now, most of the data used by an analyst will be from local, on-premise data sources. And while local files and static database pulls are relatively easy, enabling a data refresh from a database server to an online report gets complicated. Microsoft reworked and updated the original Data Management Gateway into the new Power BI Personal Gateway to handle this task.
OneDrive based Report
When it comes to analysis, it's all about the data. Power BI is about setting analysts free to rapidly build and deploy reports for their organizations. To get started, I setup an account using my company e-mail (more about that later) and spent some time exploring. First I wanted to see how quickly I could build out a dashboard and share it. I decided to use an existing Excel workbook on my personal OneDrive that had sample sales data from a SQL Server Adventure Works data warehouse.
Using the Get Data tool I navigated to my personal OneDrive and located the Excel workbook. With the Excel file selected I clicked on the Connect button and waited while Power BI loaded the data into a new Power BI dataset that was assigned the same name as the Excel file. After that Power BI automatically created a new dashboard with the same name. Curiously, my new dashboard had an empty frame which it turns out was not as it should be. The online documentation indicated that the frame in the dashboard should have included the name of the attached dataset. Still, clicking on the empty frame displayed the work area for reports. The columns from my Excel workbook were on the far right with the central area ready to have one or more visualizations (graphs) to be added. To Power View users, this will look familiar.
Within minutes, I had three visualizations in my unsaved report (see Figure 1). On saving, it saved as a report. Back to the dashboard, I shared it via e-mail. The overall process took only a few minutes. But, the shared dashboard was empty. The missed step was that one or more of the report visualizations must be pinned to a dashboard. Returning to the report, all that was required was to pin one of the visualizations to my dashboard and the report was immediately visible to the share recipient.
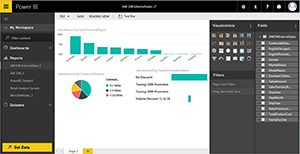 [Click on image for larger view.] Figure 1. A simple report based on an OneDrive Excel file took only a few minutes to create and share.
More than Online
In addition to the online portal, Power BI has several application components that expand Power BI's functionality and ease of use. Building a simple report online can be easy, but advanced reports benefit from a locally installed tool. The Power BI Desktop application handles this nicely. And while the portal makes connecting to online resources straight forward, a lot of data is from on-premise databases. Two additional components enhance connections with local databases. To support scheduled or on-demand data refreshes for your reports, the Power BI Personal Gateway manages your connections to local, on-premise databases such as your SQL Server data warehouse. For real time access to your Analysis Services tabular database you will want to utilize the Power BI Analysis Services Connector. And the Power BI mobile apps for Windows, iPhone and Android devices are available to all users, even the free accounts. Let's take a closer look at the key steps and components used to share a report in Power BI.
Account Setup
Starting at the Power BI Web site, create an account using your work e-mail. With its focus on business, the Power BI site blocked out my attempts to create an account using personal e-mails at msn.com, gmail.com and yahoo.com. Once you've setup an account and logged in you are taken to the welcome screen. Since BI is all about the data, the welcome screen suggests that your first task is to get data for a report. This screen is nearly identical to the Get Data screen, so you'll see it many times using Power BI.
Online Workspace
The online workspace has a minimalist, clean layout. On the left are three sections that hold your Dashboards, Reports and Datasets. On the top right are selections for downloads, getting help, providing feedback and your Power BI account. The Dataset section holds all of the datasets that have been imported into your account using the Get Data option (see Figure 2). Likewise, the Reports and Dashboards sections hold respectively the reports and dashboards you have created.
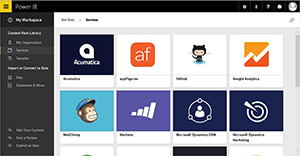 [Click on image for larger view.] Figure 2. A sampling of the available online services list from the Get Data option.
Get Data
Online, the Get Data option offers the ability to acquire data from a growing list of online services, local or OneDrive files, databases in Azure and Spark on Azure HDInsight. There's even a feature to connect to an Analysis Service tabular database. In our first dashboard, we used an Excel workbook from our OneDrive account. A gold star on the right side of the dataset name designates it as a new item (same with new reports and dashboards). Next to each data set is a three dot ellipsis that provides a limited set of actions (see Figure 3). The Schedule Refresh selection will take you to the Settings page, while the Refresh Now starts the refresh of data from our OneDrive Excel file.
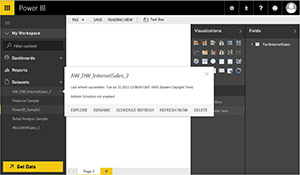 [Click on image for larger view.] Figure 3. Using the ellipsis next to the Dataset brings up the menu options.
Reports
A new report starts with the selection of a dataset. Simply click on a dataset and the work area for a new report appears. On the right side of the page, the dataset, with all of the data elements are listed. Select an element such as SalesAmount and a default visualization graph is created (see Figure 4). You can leave the graph as is, or change it to one of the currently installed visualizations. Visualizations include line, dot, bar and pie charts, a data table, a data slicer, and maps. As you add visualizations to the report, you'll start to notice that they are dynamically filtered in unison. If you click on sales for year 2008, the other visualization graphs are dynamically filtered to only include data from the year 2008. This is the feature that's made QlikView a popular tool.
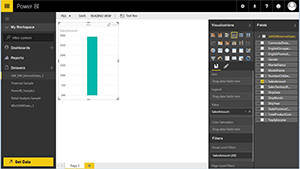 [Click on image for larger view.] Figure 4. In a report, new visualizations start with initial default bar chart.
Dashboard
Dashboards are containers to be shared. One or more report visualizations can be pinned to a dashboard, from one or more reports (see Figure 5). When a dashboard is initially displayed to a share recipient, the visualizations are static. However, click on one of the visualizations, and Power BI generates the full interactive report showing all of the visualizations in the report, including those not on the dashboard.
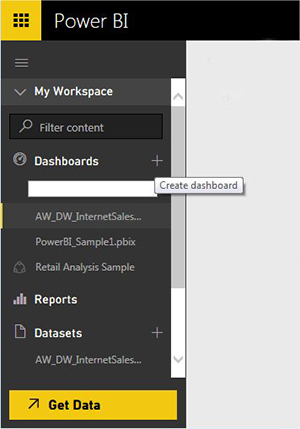 [Click on image for larger view.] Figure 5. Add a new dashboard to create multiple views of the report data to match the user.
To create a new dashboard, simply use the plus sign to the right of the Dashboard header section. If you have an existing report, you can pin a visual component of it to the highlighted dashboard. It only displays the last dashboard in the report. Perhaps in the future, it will let you choose which dashboard to render. The ellipsis to the right of the dashboard displays a list of options including Share and Settings. With the Share option, you can send an invite by e-mail. A separate tab lets you see who this Dashboard has been shared with and you can update the share if desired. It is important to note that the Settings option is not just for Dashboards. It takes you to the main settings page. This is the same settings page used by the Dataset Schedule Refresh option. It's unclear why the different names.
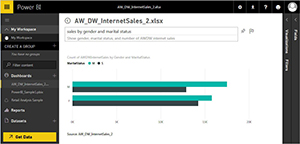 [Click on image for larger view.] Figure 6. The natural language Q&A filter lets user go beyond the pre-designed filters and slicers.
Data Refresh
One time reports are great, but it is not uncommon for a one-time report to need a data refresh. Power BI has this covered. Some data sources, such as our OneDrive file, can only be manually refreshed. That makes sense since it is coming from my personal account. But what about when it is connected to the company's data warehouse? That requires the installation of the Power BI Personal Gateway and the Power BI Desktop. With the Personal Gateway and the Desktop installed, I was able to design a more involved report pulling data directly from a SQL Server data warehouse into a Power BI report that could be scheduled for a refresh.
Power BI Desktop (Designer)
As its initial name implies, Power BI Desktop (formerly Designer) is primarily a report design tool. And it's a fairly powerful one at that (see Figure 7). You can connect to a large number of on-premise databases such as SQL Server and Teradata, local files, and various online resources like Azure and Salesforce. The workflow is similar to the online portal, but the look and feel is closer to Excel. And as a locally installed design tool, the occasional online lag is avoided. With the Desktop, the focus is on a single report. Once you've completed a report, you save it as a complete .pbix file, with data. Switch back to the portal, and import the .pbix file. A new dataset and a new report are created inheriting the name of the file. So if the Desktop file has a full name of PowerBI_Sample1.pbix, both the dataset and the reports will have the name PowerBI_Sample1.
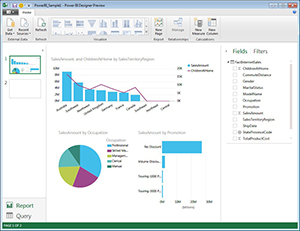 [Click on image for larger view.] Figure 7. The Power BI Desktop using data from a data warehouse on a remote server.
Power BI Personal Gateway
The Power BI Personal Gateway provides a bridge between your reports and on-premise data sources that need to be refreshed. Its personal, in that you install this as a service on your machine, to manage your refreshes. And Gateway, in that when a refresh is requested for one of your datasets, your personal gateway manages the connection. For current Power BI for Office 365 users, Power BI documentation suggests that you can continue to use Data Management Gateway.
Pricing
Prior to the official release, the basic version was listed as free, with the Pro version listed as $9.99/user/month or included with some of the enterprise Office 365 versions. All offer the ability to use the Power BI Desktop, use of the mobile apps, access to the extended connection packs and the ability to refresh and stream data. The Pro version expands data storage from 1GB to 10GB, allows for hourly verses daily refresh schedules and increases the streaming limit from 10K rows/hour to 1 million rows/hour. But perhaps the best feature of the Pro version will be the ability to use Active Directory groups for sharing and managing access control.
So, is Power BI a must have tool? Clearly a lot of effort has been put into making Power BI very capable. And the ease and freedom given to analysts to create and deploy reports will be a big attraction on the business side. Companies already making the move to Office 365 and the cloud will find that it fits in with their plans. Organizations not ready for the cloud may not like the exposure and lack of control. Still, with an entry price point of free, no need for Office 365, SharePoint or IT resources, and the overall ease of use, Power BI just may become the major force in personalized, self-service BI.