Joey on SQL Server
Tracking Performance Impacts of SQL Server Changes
Getting a bird's eye view can help to quickly spot trouble areas.
- By Joey D'Antoni
- 02/23/2022
A common task that all database and system administrators face is patching systems. Patching your systems is very important -- first and foremost, security fixes are included in patches. Patches also typically resolve existing bugs and improve the overall stability of your database engine or operating system. However, patching is not without peril. Occasionally new bugs are introduced in patches that are fixing other problems. In some cases, these bugs are obvious. For example, there was a cumulative update (CU) that broke replication in SQL Server a few years ago. The process when there is a major problem like that, is that Microsoft pulls the update down, then rereleases a newly updated CU.
While obvious problems like breaking replication happening are rare (and very obvious) there can be more subtle impacts. If you have the right combination of settings enabled, and a change in query optimization is made in an update, you may see performance degradation. Though this behavior is extremely rare, it can happen. However, having the tools to troubleshoot are a key tool in the DBA's kit. These changes in behavior aren't limited to only patches -- there could also be a settings change, new hardware, or even application changes that change your schema.
I ran into a situation over the weekend where a client installed the latest CU and perceived that there may have been more queries waiting on context switching (CXCONSUMER and CXPACKET), which could be a sign of performance degradation. The client is on SQL Server 2019, which meant I had a lot of available tools to perform this analysis. The first is the Query Store, a feature introduced in SQL Server 2016 and improved in each release.
The important change to Query Store that I'm using in this demo, is that wait statistics are tracked with. This addition was added in SQL Server 2017 and is also available on all flavors of Azure SQL. SQL Server tracks what every thread is waiting on, when that thread is not actively executing. This data gets accumulated instance wide and is an extremely valuable approach to understanding server performance and identifying bottlenecks in code or hardware. However, those statistics are cleared every time the instance is restarted. This means using wait stats to track behavior after a CU is challenging. You can track this, but you need to write your own code/system to store existing wait information and follow it over time.
The basic query I wrote for my data collection is as follows:
SELECT convert(DATE, qsrsi.start_time) AS ObservationDate

  ,qsws.wait_category_desc

  ,sum(qsws.total_query_wait_time_ms) AS TotalWait

  FROM sys.query_store_runtime_stats_interval qsrsi

  INNER JOIN sys.query_store_wait_stats qsws ON qsws.runtime_stats_interval_id = qsrsi.runtime_stats_interval_id

  GROUP BY convert(DATE, qsrsi.start_time)

  ,qsws.wait_category_desc

  ORDER BY convert(DATE, qsrsi.start_time) DESC
I'm using two Query Store views—sys.query_store_wait_stats and sys.query_store_runtime_stats_interval. This query gives me the total amount of milliseconds spent on each wait type category for each day. While this information will not help you tune an individual query, it can broadly show the wait profile for a given database. Those last few words are key here -- if you only have one user database on your server, this query will be enough for you. However, if like most SQL Server instances, you have multiple user databases, you need to aggregate the Query Store data from each database.
I developed this code below—it depends on having a DBA database locally, but you could also write your data to TempDB and just grab the results.
CREATE DATABASE DBA

  GO
USE DBA

  GO
CREATE TABLE QS_Wait_Stats (

  DBName NVARCHAR(128)

  ,SrvDate DATE

  ,Wait_Category NVARCHAR(128)

  ,Total_Wait_Time BIGINT

  )

  GO
DECLARE @dbname NVARCHAR(128)

  DECLARE @command NVARCHAR(MAX)
DECLARE db_cursor CURSOR

  FOR

  SELECT name

  FROM master.sys.databases

  WHERE is_query_store_on = 1;
OPEN db_cursor
FETCH NEXT

  FROM db_cursor

  INTO @dbname
WHILE @@FETCH_STATUS = 0

  BEGIN

                  SELECT @Command = '      USE ' + @dbname + ';

                              insert into dba.dbo.QS_Wait_Stats SELECT db_name(), convert(DATE,  qsrsi.start_time) AS ObservationDate

                   ,qsws.wait_category_desc

                   ,sum(qsws.total_query_wait_time_ms) AS TotalWait

  FROM ' + @dbname + '.sys.query_store_runtime_stats_interval qsrsi

  INNER JOIN ' + @dbname + '.sys.query_store_wait_stats qsws ON qsws.runtime_stats_interval_id  = qsrsi.runtime_stats_interval_id

  GROUP BY convert(DATE, qsrsi.start_time)

                   ,qsws.wait_category_desc'
       EXEC sp_executesql @command
       FETCH NEXT

  FROM db_cursor

  INTO @dbname

  END
CLOSE db_cursor
DEALLOCATE db_cursor
Aggregating this data across all of the user databases on your instance can give you an interesting profile of what's going on in your server. I would recommend using the Query Store on all of you databases. The overhead is low in most instances, and the insight into query performance is invaluable. Just last night I was able to troubleshoot the root cause of an incident that happened a week ago in about five minutes by using the Query Store reports that are built into SQL Server Management Studio.
To better analyze this data, I visualized it using Power BI. Apologies to my co-worker Meagan, and any other data visualization professionals out there, but I felt like using a stacked bar chart was the easiest way to identity patterns in this data.
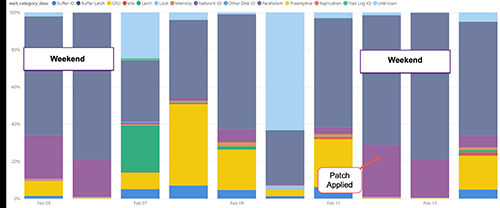 [Click on image for larger view.] Figure 1.
By visualizing this data this way, I can see that my wait profiles on both weekends were similar. You don't need to be a senior DBA to observe the differences in wait profiles in this chart. While Monday's wait profile was slightly different from the previous Monday, it was very similar to that of Friday, showing us that installing the CU did not have any obvious impact to overall system performance. This is a very high-level view of this server's performance. I would consider this to be a first stop in performance tuning, as a place to focus your efforts. You can also use this data to see which of your databases is spending the most time waiting.
Microsoft's goal for the Query Store was to help DBAs facilitate upgrading to newer releases of SQL Server by providing persistent performance data to could be analyzed over time. In this example you've learned about an approach to combine the power of the Query Store with the wait statistics captured by SQL Server. This approach allows us to quickly analyze the overall performance profile of a server. You can also get more involved with the data in your analysis and get a more granular profile of query performance in an individual database.
About the Author
Joseph D'Antoni is an Architect and SQL Server MVP with over two decades of experience working in both Fortune 500 and smaller firms. He holds a BS in Computer Information Systems from Louisiana Tech University and an MBA from North Carolina State University. He is a Microsoft Data Platform MVP and VMware vExpert. He is a frequent speaker at PASS Summit, Ignite, Code Camps, and SQL Saturday events around the world.