Posey's Tips & Tricks
How To Create Microsoft Visio Diagrams in Excel
Microsoft recently made some significant enhancements to its Visio add-in for Excel, enabling users to create Visio diagrams from within Excel. Here's how it works.
Even though Visio is easily one of the more obscure Microsoft Office applications, it's something that I find myself using quite often. If you are not familiar with Visio, it's used for creating diagrams such as flow charts and network diagrams.
What I didn't realize is that you can actually create Visio diagrams from within Excel. In fact, Microsoft recently made some significant enhancements to its Visio add-in for Excel. In this column, I will show you how it works.
Creating a Visio chart in Excel is not quite as simple as choosing a Visio option from the Insert menu. To get started, you will need to download a Visio add-in. The easiest way to do this is to launch Excel, then choose the New option. Rather than clicking on one of the available templates, type the word "flowchart" into the search box, as shown in Figure 1.
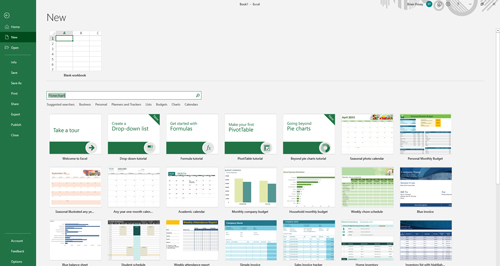 [Click on image for larger view.] Figure 1: Type "flowchart" into the search box.
This will cause Excel to display a number of Visio add-ins similar to what you see in Figure 2.
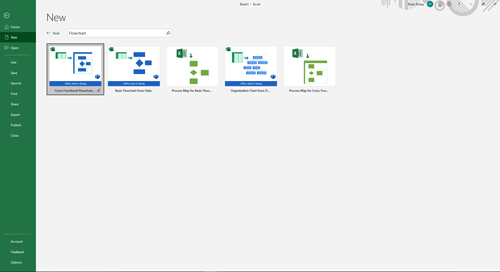 [Click on image for larger view.] Figure 2: There are several Visio-related templates available for use.
For the purposes of this column, let's take a look at the Basic Flowchart from Data template. Simply click on the template, then click the Create button to get started. Depending on how your Office environment is set up, you may be prompted to click on a Trust This Add-in button.
At this point, you will be taken to the screen shown in Figure 3. As you can see, the add-in prompts you to select a cell in an empty area of the spreadsheet, and to then select the type of diagram that you want to create. Notice in the figure that the four basic flowcharts are not the only options; there are also five cross-function flowcharts and five organizational charts available.
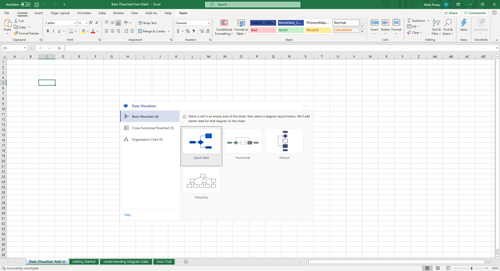 [Click on image for larger view.] Figure 3: Select an empty cell and choose the type of flowchart that you want to create.
Let's take a look at the Basic Flowchart Quick Start option. Figure 4 shows what happens when you choose this option.
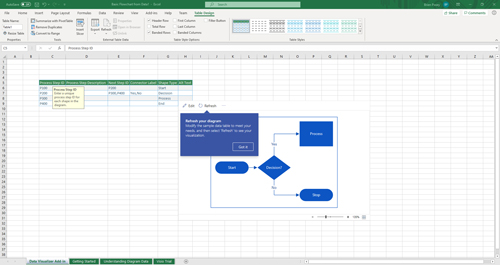 [Click on image for larger view.] Figure 4: This is what happens when you choose the Basic Flowchart Quick Start option.
As you look at the figure above, you will notice that the upper-left portion of the spreadsheet contains a data table, with the resulting flowchart being displayed in the center of the screen. There is also a message indicating that as you make changes to the data, you will need to click Refresh to see those changes reflected in the chart.
This raises the question of how you can incorporate your own data into the chart. Keep in mind that the diagram shown in the figure is intentionally simple; there are more elaborate templates available. I picked this particular template so I could show you the basics.
With that said, you will notice that the spreadsheet's first column is Process Step ID. Every step in the flowchart is given an ID. These IDs are assigned a number (P100, P200, P300, etc.).
The next column contains the process step description. This column controls the text that is actually displayed on the flow chart in relation to the step.
The third column is the next step ID. This is the column that controls step linkages. For instance, the first step in the chart, P100, has a Next Step ID of P200. This means that P200 will be linked to P100.
Notice that P100 is labeled as Start and P200 is labeled as Decision. Because P200 is listed as the next step from P100, there is an arrow in the diagram going from Start (P100) to Decision (P200). Because P200 is a decision step, it lists two next step IDs (P300 and P400).
The next column is the connector label. You will typically only use connector labels with decision steps, but you could conceivably use connector labels to annotate any step. Simply enter the text that you want to display in association with the connector.
Finally, there is a column that allows you to specify the shape that is associated with each step. In this basic flowchart, there are only four options: Start, End, Decision and Process. Some of the more advanced charts might offer additional shapes.
One last thing that I want to point out is the tabs at the bottom of the spreadsheet. The Visio add-ins are relatively straightforward, but if you do need extra help, these tabs can point you in the right direction. The Getting Started tab, for example, guides you through the steps involved in creating a chart, as shown below.
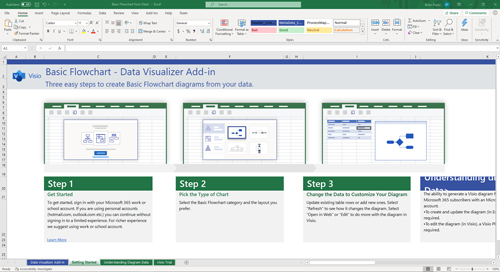 [Click on image for larger view.] Figure 5: The tabs at the bottom of the screen can provide some extra help.
About the Author
Brien Posey is a 22-time Microsoft MVP with decades of IT experience. As a freelance writer, Posey has written thousands of articles and contributed to several dozen books on a wide variety of IT topics. Prior to going freelance, Posey was a CIO for a national chain of hospitals and health care facilities. He has also served as a network administrator for some of the country's largest insurance companies and for the Department of Defense at Fort Knox. In addition to his continued work in IT, Posey has spent the last several years actively training as a commercial scientist-astronaut candidate in preparation to fly on a mission to study polar mesospheric clouds from space. You can follow his spaceflight training on his Web site.