Statistically Speaking
Retrieve index statistics using the sys.dm_db_index_physical_stats function.
- By Joshua Jones
- 03/22/2010
As DBAs, we quite often find the need to take a look at new databases (or old databases we haven't seen in awhile), and figure out what shape the indexes are in. For those of us who do consulting work, you probably find this work is particularly familiar territory. Fortunately, when SQL Server 2005 shipped, we had a whole new set of internal views and functions -- called dynamic management views and functions -- that give us insight into tons of different SQL Server statistics. One of the most useful is sys.dm_db_index_physical_stats.
So what does this function do? It simply outputs all of the information DBAs need to quickly see when evaluating the fragmentation status of their indexes. Here's a code sample for a simple execution, along with some sample output:
SELECT *
FROM sys.dm_db_index_physical_stats(NULL,
NULL, NULL, NULL , 'DETAILED')
This code is easy; the parameters, in order, are Database ID, Object ID, Index ID, Partition Number, and Mode. Database ID and Object ID are pretty obvious; they are the database and table you want to query. Leaving these values NULL returns all information for all databases and/or all tables.
Index ID specifies which specific index you want to look at; Index ID 0 is the heap for the table, and NULL returns all indexes.
The Partition ID pertains to partitioned tables, and can help narrow down the field of data to a specific partition. The default 1 is given for any non-partitioned table.
Finally, there's the Mode parameter. This tells the function how much information to return (or how many pages deep to scan). The valid values are DETAILED, LIMITED, SAMPLED, and NULL (or DEFAULT). DETAILED tells the function to scan all pages for the specified indexes and return the data. LIMITED scans only the parent-level pages in an index, and the PFS and IAM pages for a heap. SAMPLED scans 1 percent of the pages in the index or heap (unless the index/heap has less than 10,000 pages, in which case DETAILED is used anyway). Finally, the default of NULL actually means LIMITED.
Now let's take a look at some output, shown in Figs. 1 and 2. .
 |
| Figure 1. First 12 columns of output.(Click image to view larger version.) |
 |
| Figure 2. Last 9 columns of output.(Click image to view larger version.) |
Those figures show quite a bit of information. The column names are pretty descriptive; the one that can be deceptive is, of all things, record_count. This column actually represents the number of records, not necessarily the number of rows, as some may assume. Since, in a heap, a row may actually contain multiple records, if it has a forwarding record and a forwarded record as a result of an update that moved the data. However, this number is useful enough to figure out roughly how large a given index/heap is.
In order to make this more useful, I've written two short pieces of code that help me scan a databases index and make decisions on how to proceed with maintenance and/or troubleshooting. Here's the first script:
DECLARE @db_id SMALLINT;
DECLARE @object_id INT;
SET @db_id = DB_ID(N'DBNAMEHERE'); --<<<CHANGE TO YOUR DB NAME
SET @object_id = OBJECT_ID(N'dbo.TABLENAMEHERE');
--<<<CHANGE TO A SPECIFIC TABLE NAME IF DESIRED
IF @db_id IS NULL
BEGIN;
PRINT N'An invalid database was specified';
END;
ELSE IF @object_id IS NULL
BEGIN;
PRINT N'An invalid object was specified';
END;
ELSE
BEGIN;
SELECT * FROM sys.dm_db_index_physical_stats(
@db_id, @object_id, NULL, NULL , 'DETAILED');
--<<<Remember to set the mode
END;
This code just helps specify a single table in a single database, and gives me some basic error control. I can use this code to further automate scans of a database, or of specific objects.
Here's another piece of code:
DECLARE @db_id SMALLINT;
SET @db_id = DB_ID(N'DBNAMEHERE'); --<<<CHANGE TO YOUR DB NAME
SELECT object_name([object_id]) as [Object_Name], index_id, index_type_desc, index_level, avg_fragmentation_in_percent, fragment_count, page_count
FROM sys.dm_db_index_physical_stats (@db_id, NULL, NULL,
NULL, 'DETAILED')
where avg_fragmentation_in_percent > 50
--Filter by level of fragmentation
and fragment_count > 100
--filter by number of fragments; more fragments = more pages
= larger tables
order by avg_fragmentation_in_percent desc;
I've found this code to be more useful in situations where I'm trying to find the TOP N worst fragmentation victims. I can quickly see which indexes have problems and need to be addressed first. I've also filtered out columns I didn't initially want to see; this column set gives me the ability to see which object (by name) is having issues, as well as basic information on the state of the indexes.
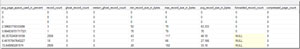
 |
| Figure 3. Sample output using the sample code. (Click image to view larger version.) |
Fig. 3 shows some sample output from the second query. I've got a single clustered index on a table named EventGroup that has just over 50 percent fragmentation, and has 481 fragments in 922 pages. While this isn't horrible, it may indicate that I need to make sure there is an index maintenance job in place to take care of this issue.
Again, both of these code samples can be used in automated jobs to help find and eliminate fragmentation issues. So experiment, and have fun!
About the Author
Joshua Jones is co-author of A Developer's Guide to Data Modeling for SQL Server: Covering SQL Server 2005 and 2008 (Addison-Wesley Professional, 2008) and is a principal with Denver-based Consortio Services LLC.