Joey on SQL Server
That One Easy Trick for SQL Server Performance
Here's how to fix that performance database query to speed up response time.
- By Joey D'Antoni
- 09/28/2021
As a consultant whose job description includes putting out performance fires, I get to see a lot of problematic queries that can dramatically harm overall server performance and throughput.
Wondering why that Web-based app is so slow to load? It could be an issue with a poorly performing database query. Sure, the issue may be hiding behind an API call. But at the end of the stack, usually some kind of data store (most commonly a relational database) is behind that call.
I’m going to focus this discussion on SQL Server (and Azure SQL Database and Managed Instance), but similar concepts apply if you are working with other database engines.
To understand database server performance, you need to understand a few basic concepts, like how database servers use memory and CPU (the basics of query execution), and how these concepts work together. If you are unfamiliar with database internals, you may wonder why the database servers are always consuming 80 percent or more of the available memory. The reason is database engines like to cache everything -- round trips to the disk subsystems are expensive, compared to a call to memory, so databases aggressively cache data pages in a memory area called the buffer pool.
Beyond just the table pages in the buffer pool, query results require memory to process operations like sorts and joins, so each query that's executed is granted memory. If there’s not enough memory, SQL Server will treat the TempDB as page file in an operation known as a spill. Finally, the other major area of memory (in SQL Server) is known as the execution plan cache, which stores the compiled order of operations the database uses to return the results of your queries.
Execution plans are cached because they require a lot of CPU to be generated. The query optimizer has statistics about the distribution of data in columns and indexes and will churn through those stats to generate the best set of operations and amount of memory for a given query. Because this operation is resource intensive, SQL Server will cache the execution plan in memory, and if the same query is executed again, it will reuse the execution plan. You should note, there are nuances around parametrization and dynamic SQL, that can hamper plan reuse, so one common metric that DBAs looks to when diagnosing a high CPU condition is the number of compilations taking place on a server. Developers can influence this behavior with query hints, but that should only take place after all other options are exhausted.
You have a query, and an execution plan—so where do you go from here? The execution plans are stored as XML in the plan cache and are also available for querying in dynamic management views and the Query Store. If you have queried a plan from one of those places, it is presented as XML in query results, but you can click on the plan and see it graphically as shown below. You can also capture an execution plan at query runtime, either by using the Extended Events tooling that is built into SQL Server (be careful with this -- it can be very resource intensive), or by using SQL Server Management Studio, if you are executing the query there.
Execution plans are a complex topic (there are several books written on them), but I want to focus on two aspects of execution plans that can be pretty helpful when trying to troubleshoot a performance problem -- in this case, a high CPU and slow query response time condition. Query execution consumes CPU resources, but a high CPU can be driven by excess scanning of records or poor query patterns that require row-by-row operations. In this example, I’m going to focus on both of those. The execution plan below is very large, but we are going to focus on a couple of high-value things.
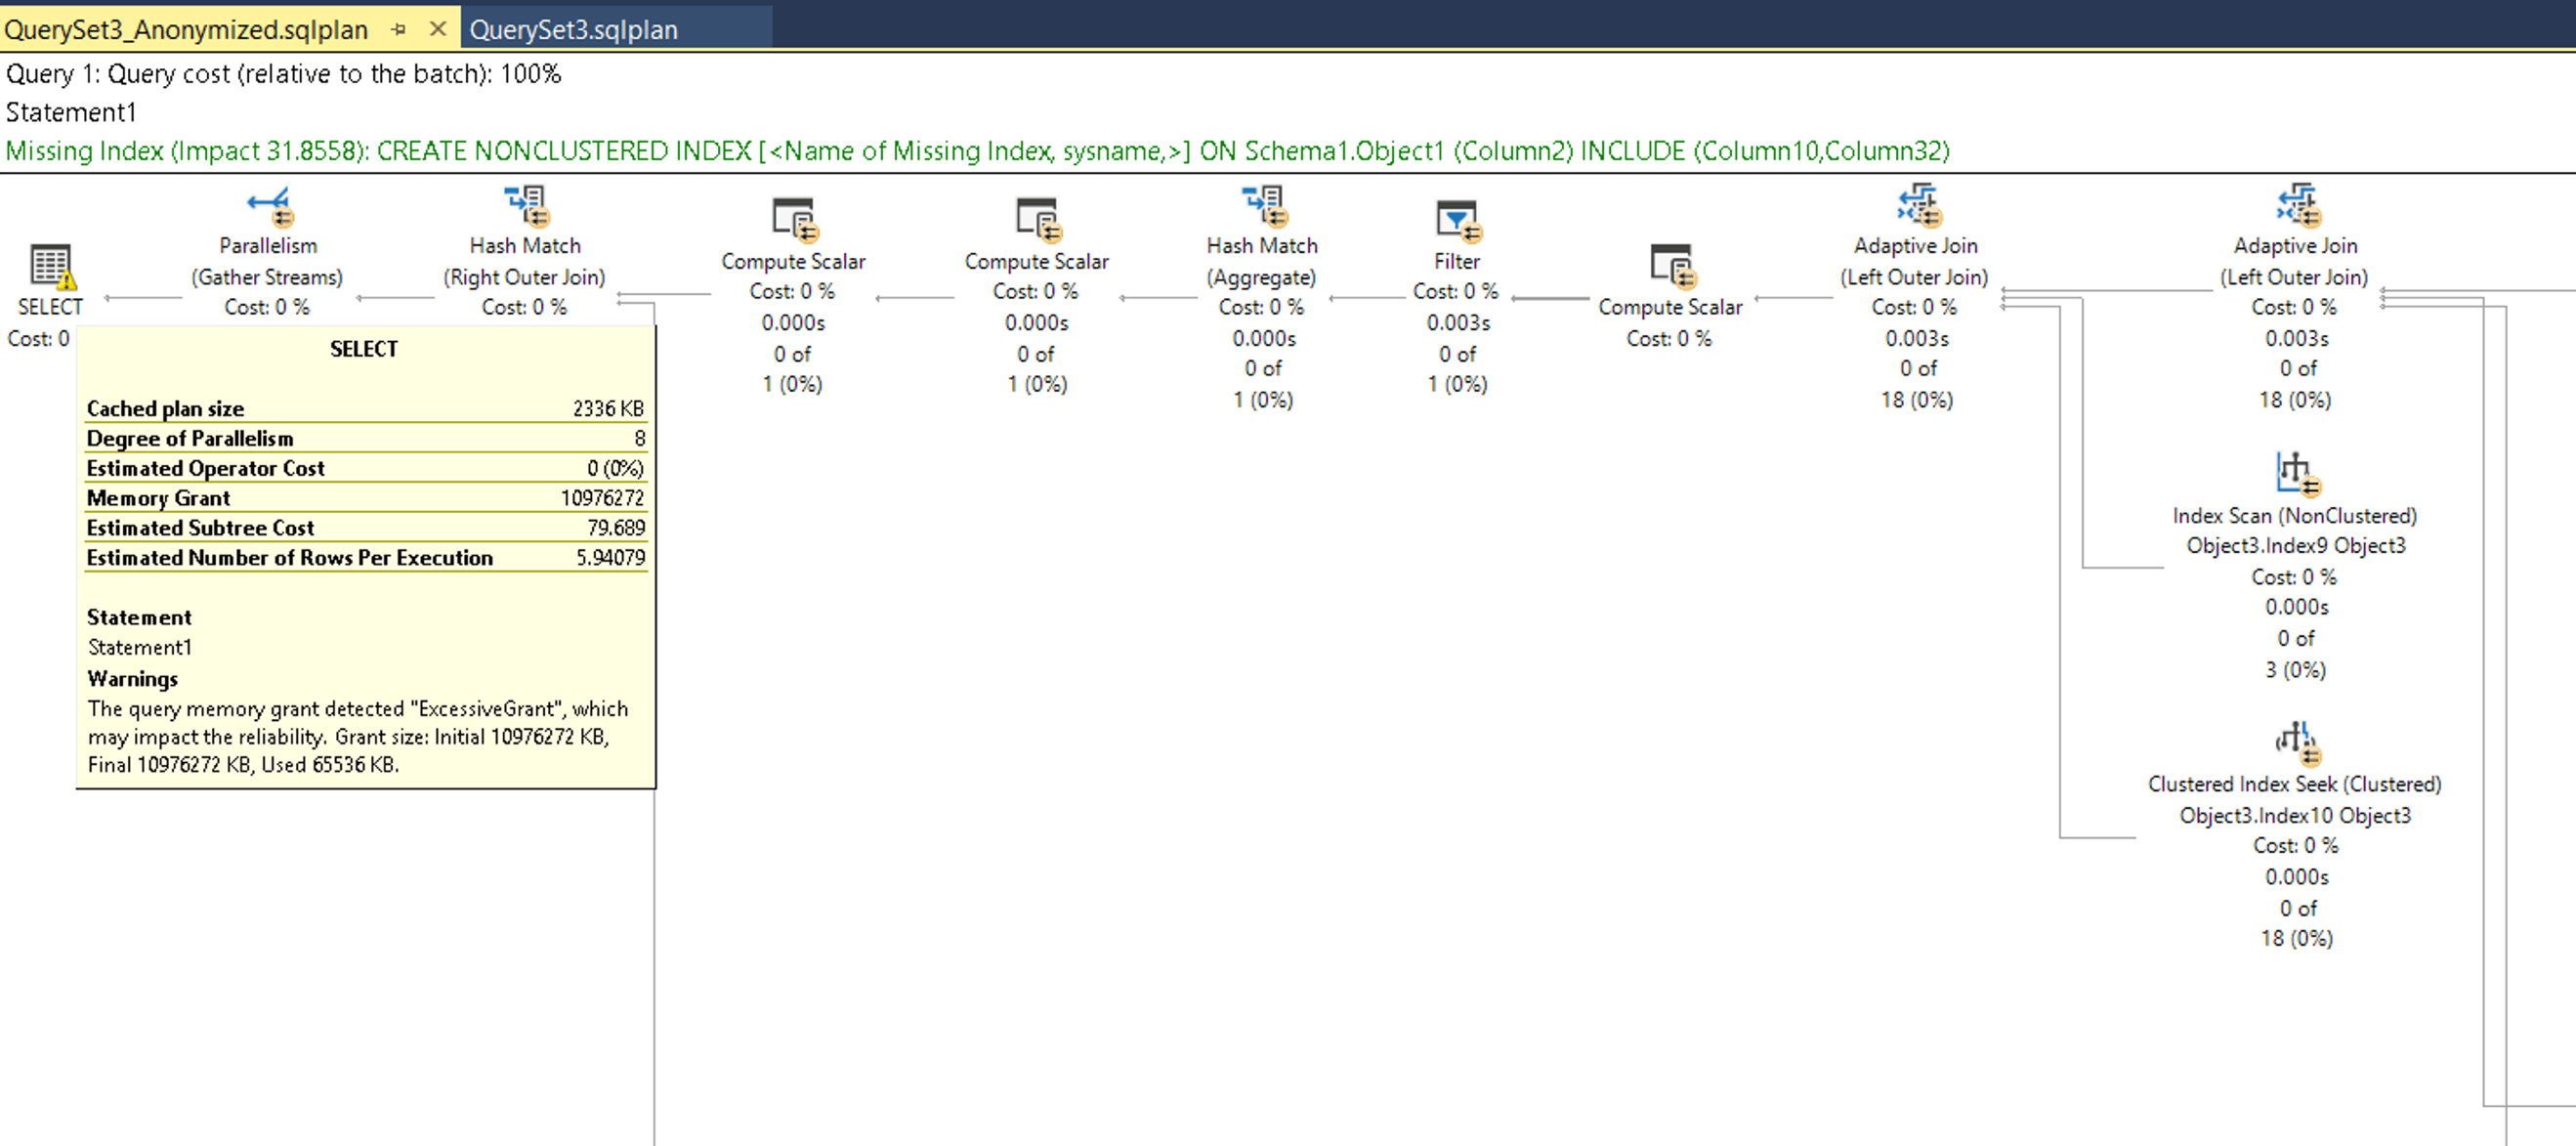 [Click on image for larger view.] Figure 1. Execution plan of a server query.
As you can see in the above execution plan, SQL Server has highlighted a missing index that it thinks would help our query improve. This information can be very helpful but needs to be taken with a grain of salt -- you should evaluate any other indexes on the table, to ensure that you are not creating a duplicate index. But, in general, indexing advice definitely has validity, especially for a frequently run query. Let’s drill down a little deeper into the plan and discuss the dreaded “key lookup” operator.
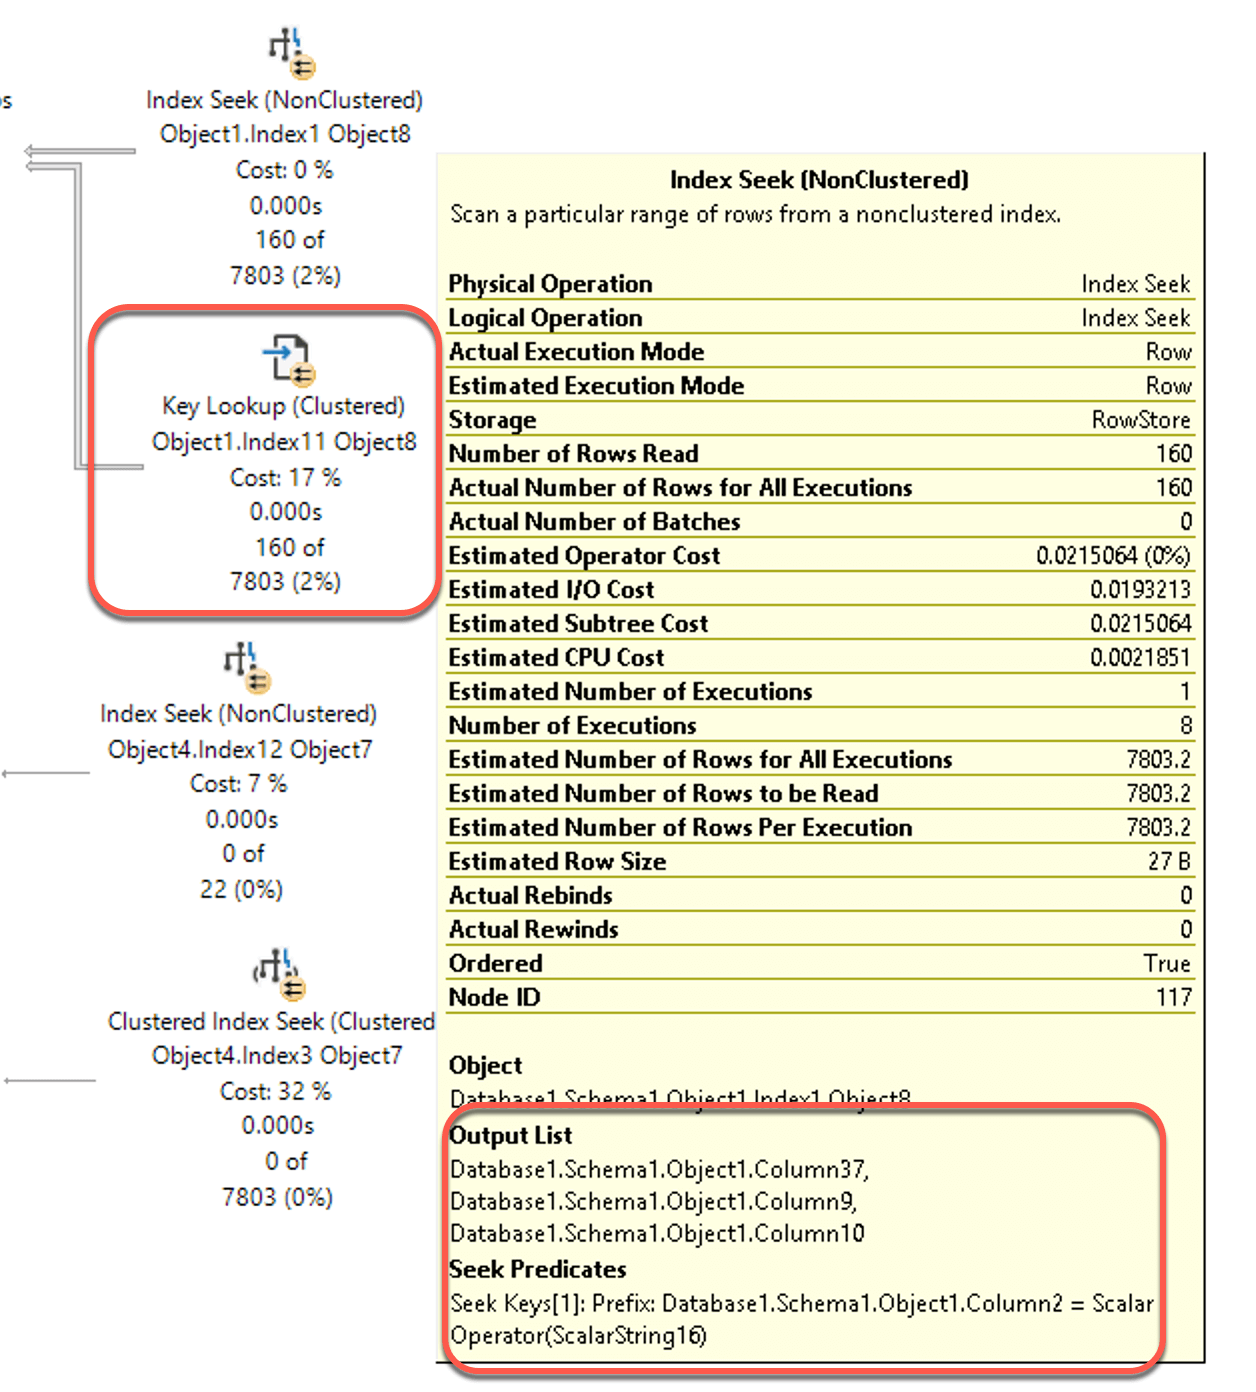 [Click on image for larger view.] Figure 2. The Key lookup operator for the server query.
Key lookups are costly, because for each record the database engine finds in the correlated index seek, the engine has to go back to look up the other columns in the table to fulfill the query. On a particularly wide, or big table this will make for a very slow query. This is pretty easy to fix with what DBAs call a covering index. The engine suggested we create an index on Object1, specifically with a key column of Column 2, and including Columns 10 and 32. However, if you mouse over the index seek operation, as shown above, you can see the predicate (the WHERE clause in your query) was Column2, making it an appropriate key. The output list includes columns 37, 9 and 10. So you would want to create the following index to improve the performance of this query:
CREATE  INDEX NCI_Object1_Column2_Col37_Col9_Col10 on Object1 (Column2)

  INCLUDE  (Column37, Column9, Column10)

  WITH  (DATA_COMPRESSION=PAGE)
While I anonymized this query plan, this is from a real server where this query was taking over five minutes to run. Adding that index dropped the execution time to 500 milliseconds. One other thing to note in my CREATE INDEX statement is that I set the index to use data compression. Since SQL Server 2016 SP1, compression is built into all editions of SQL Server, and reduces the number of pages an object consumes, both on-disk and as it traverses through memory. There is a small amount of CPU overhead to compress and decompress pages, but the IO reduction is well worth the trade off, particularly on larger tables and indexes. You can read more about data compression here.
Performance tuning your databases can dramatically improve the performance of your application stack. As you have seen above, how resources are utilized, how plans are generated (and how frequently) all play a part in overall performance. However, it is not always as simple as this example. Often we see development organizations that use object-relational mapping (ORM) tools that generate database schemas with minimal thought or planning for growth.
Nevertheless, most databases will have some low hanging fruit in terms of indexes that can provide substantial improvements in runtime. Look at those missing index recommendations, and evaluate the use of data compression (remember, you have to compress each table and index indepently, there is no “compress my database” button) to reduce storage and memory utilization.
About the Author
Joseph D'Antoni is an Architect and SQL Server MVP with over two decades of experience working in both Fortune 500 and smaller firms. He holds a BS in Computer Information Systems from Louisiana Tech University and an MBA from North Carolina State University. He is a Microsoft Data Platform MVP and VMware vExpert. He is a frequent speaker at PASS Summit, Ignite, Code Camps, and SQL Saturday events around the world.