Joey on SQL Server
Why Activity Monitor May Be Hurting Your SQL Server's Performance
As Joey explains, Activity Monitor consumes a lot of resources and yields little usable data. Here are some third-party alternatives.
- By Joey D'Antoni
- 08/25/2021
I get to work with a lot of customers, so I get to see a lot of SQL Servers -- and a lot of SQL Server performance problems. No one calls us when everything is running well.
One thing I have noticed in a number of recent consultations is the use of Activity Monitor for troubleshooting performance issues on a server. Activity Monitor is a tool inside Microsoft's SQL Server Management Studio that may seem innocuous. However, Activity Monitor can consume a lot of server resources, particularly if it runs on SQL Server Management Studio on your database server. (Don't do this. Stop hitting yourself!)
The basic idea of monitoring the performance of any type of computer system is to minimize resource consumption while doing the monitoring, which is called "observer overhead." Tools are designed with this in mind. Many tools will even reduce data collection as load increases (or allow for some data to be lost). The way most database performance tools work is by collecting a small amount of data at fixed intervals and moving that data into a data store. This data store can either be local (in the case of the Query Store, it's stored in the local database) or in another remote database (this is the more common pattern in third-party tools). In other cases, the data is simply point-in-time, where you execute some queries and review the data.
Activity Monitor is a classic example of a real-time dashboard, like we see in some business intelligence systems. While dashboards can be useful, they tend to cause a lot of observer overhead on the underlying database as they try to move toward real-time. In the case of Activity Monitor, it runs 13 queries every 10 seconds to constantly refresh its dashboard. I've even seen scenarios where, on a busy server, TempDB performance can be negatively impacted by the frequent queries that populate temporary tables. Beyond the performance implication, the frequent refreshing of the dashboard is distracting and unhelpful.
Let's Talk About the Data
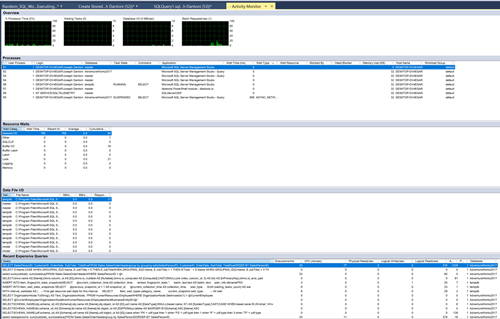
Beyond Activity Monitor's performance impacts, it is frankly not a very effective tool for monitoring server performance. Let's take a look at a screenshot from my demo virtual machine:
 [Click on image for larger view.]
In the top section are a few charts that show us server utilization numbers. While CPU numbers and batch requests/second are useful metrics, you do not necessarily need to see them updated in real-time. Waiting tasks and database I/O are not super useful for real-time tuning and have a decent amount of collection overheard. The processes pane is probably the most useful data on the entire screen, though the way the data is presented is not very helpful. To identify the last query run by a given user process, you need to right-click on the row and select details.
Resource waits are also a useful statistic, but not necessarily the way they are presented here. When you are tuning a server, you typically want to look at the aggregated waits over a long period of time, as opposed to what's waiting on a specific resource or signal at a given moment. Likewise, observing data file I/O in real-time is not something that is particularly useful. This data is only useful as an aggregation over time. Again, recent expensive queries are not particularly useful without other data involved.
What the SQL Server performance tools do better than Activity Monitor is aggregating data and highlighting outlier behavior. Nearly all of the third-party tools -- and even Query Store -- do this by correlating the available performance metrics and highlighting bottlenecks or queries that consume a lot of resources. In most cases, I can look at a database or server retrospectively and use the information in the dynamic management views (DMVs) and/or the Query Store to find what is causing the performance difficulties. SQL Server is a deeply instrumented program, allowing you to look at missing indexes and a variety of statistics that paint a clear picture of server performance. The Query Store takes this a step further by allowing the history of query execution, which would have previously required extensive tracing to collect. This query history allows you to easily identity the most common cause of database performance problems: poor query execution based on poor indexing or suboptimal query patterns.
Where the third-party tools are particularly useful is taking all of the performance information stored in the database engine and presenting it on a useful consolidated dashboard. Yes, I bashed dashboards earlier, but they aren't inherently evil when they have useful information and aren't refreshing themselves every 10 seconds. The other useful aspect of these tools is that they are better at keeping a longitudinal history of the performance of your server(s). This allows you to observe performance trends over time and identity particularly busy periods.
What Do You Use for Server Tuning?
For the most part, I cannot count on a customer having a third-party monitoring tool, so I use an assortment of open source tools and scripts that provide data about a given SQL Server instance. Some of the tools I use regularly include:
- Glenn Berry's SQL Server Diagnostic Scripts: These scripts cover a wide variety of diagnostic information in SQL Server (or Azure) and provide a good profile of the performance of a server.
- Sp_whoisactive by Adam Machanic: This script does everything Activity Monitor purports to do and does it much better. This allows you to easily observe running workloads on your server and identity what resource utilization from each session is.
- Tiger Toolbox from Microsoft Tiger Team: This covers a wide variety of tools, but if you need to do deep analysis of the performance of a server or database, this is your go-to. It covers some basics, as well as deep internals.
If you have learned anything from this post, it should be that you should never leave Activity Monitor up and running on a production SQL Server (or even against a production SQL Server from your PC). There are a lot of options for monitoring SQL Server, and most of them are comparable, so choose the monitoring approach you are most comfortable with and stick with it. Good luck and good tuning!
About the Author
Joseph D'Antoni is an Architect and SQL Server MVP with over two decades of experience working in both Fortune 500 and smaller firms. He holds a BS in Computer Information Systems from Louisiana Tech University and an MBA from North Carolina State University. He is a Microsoft Data Platform MVP and VMware vExpert. He is a frequent speaker at PASS Summit, Ignite, Code Camps, and SQL Saturday events around the world.