Posey's Tips & Tricks
How To Use PowerShell Like a Spreadsheet
Instead of viewing data in a static list, use PowerShell's grid view capability to manipulate how your data is displayed.
PowerShell is well-known for its ability to display data in rows and columns. The Get-Process cmdlet displays a long list of the various processes running on the system, as well as various attributes that are associated with those processes.
As helpful as this capability might be, however, you are not limited to viewing the information as a static list.
If you want to make PowerShell display data in a way that allows for a bit more interactivity, then one option is to display the data using grid view. Grid view takes PowerShell's table-like output and displays it within a GUI environment where you can easily manipulate the way that the data is being displayed.
Let me show you how this works using the Get-Process cmdlet in my example. If I were to simply type Get-Process, then the PowerShell window would display a list of system processes, as shown in Figure 1.
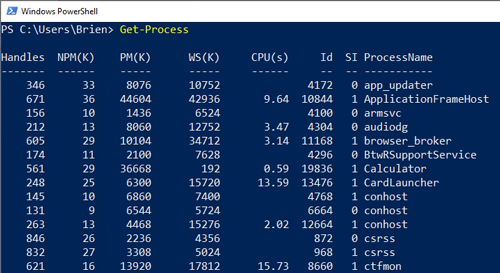 Figure 1: This is what normally happens when you enter the Get-Process cmdlet.
Now, let's use the same cmdlet, but append the pipe symbol and the Out-GridView cmdlet.
You can see both the command that I used and its output in Figure 2.
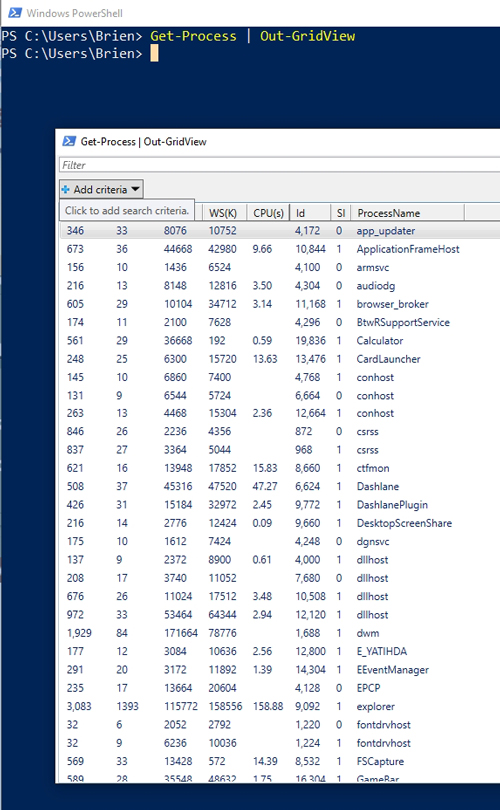 Figure 2: The Out-GridView cmdlet causes PowerShell data to be displayed in the GUI.
There are several different ways that you can interact with the grid view output. You can sort a particular column just by clicking on the column header. There is also a Filter option that you can use to filter the output. You can use the Add Criteria button to create filtering criteria based on specific columns of data.
Perhaps the thing that is most interesting about grid view, however, is that whatever changes you make to the way that the data is being displayed can be sent back to the PowerShell pipeline. If, for example, you were to display raw output in grid view and then filter that output, you could send the filtered output back to the PowerShell pipeline. All you have to do is append the -PassThru switch to the end of the Out-GridView cmdlet. When you do so, the command's output will be displayed in grid view, where you can manipulate it to your heart's content. When you are done, just click the OK button found in the lower-right corner of the grid, and your output will be sent back to PowerShell.
One important thing to note is that only the rows that you select will be sent back to PowerShell. By default, only the first row is selected.
The first time I ever tried out grid view, the thought that came to mind was that it would be great if the grid view interface contained a Save As button that could be used to save the data to an Excel spreadsheet. Unfortunately, grid view does not have a save option for your data. There are, however, at least two good ways to build a spreadsheet from your grid view data.
The first method involves copying the data to the Windows clipboard and then pasting it into Excel. This is easier to do than you might initially assume. You can actually tell PowerShell to copy the data to the clipboard:
Get-Process | Out-GridView -PassThru | Clip
Once you click OK in grid view, the data will be copied to the clipboard. After that, it's just a matter of opening Excel and pressing Ctrl+V to paste the data into a spreadsheet.
The other way to create a spreadsheet is to export the data to a CSV file. To do so, you will need to use the Export-CSV cmdlet in place of the Clip cmdlet. Just be sure to append the -Path switch and the file name of the CSV file that you want to create. Here is an example of what such a command might look like:
Get-Process | Out-GridView -PassThru | Export-CSV -Path C:\Data\Proesses.csv
It is worth noting that you can use the Export-CSV cmdlet without having to use grid view. Grid view simply gives you the ability to arrange and filter your data before writing it to a CSV file. You can, of course, accomplish the same thing by filtering the data directly through PowerShell.
About the Author
Brien Posey is a 22-time Microsoft MVP with decades of IT experience. As a freelance writer, Posey has written thousands of articles and contributed to several dozen books on a wide variety of IT topics. Prior to going freelance, Posey was a CIO for a national chain of hospitals and health care facilities. He has also served as a network administrator for some of the country's largest insurance companies and for the Department of Defense at Fort Knox. In addition to his continued work in IT, Posey has spent the last several years actively training as a commercial scientist-astronaut candidate in preparation to fly on a mission to study polar mesospheric clouds from space. You can follow his spaceflight training on his Web site.