Windows Server How-To
How To Use Server Manager To Configure Performance Alerts
Keep on top of your server's performance by setting up and checking periodic status alerts.
IT professionals largely use the Windows Server Manager as a tool for installing roles and features, or for launching other tools. Even so, the Server Manager includes a number of useful capabilities of its own. One such capability is that of being able to generate performance alerts. In this article, I will show you how this capability works.
As you are no doubt aware, the Server Manager's dashboard view includes a console tree which includes containers such as Dashboard, Local Server and All Servers. This console tree also includes containers for any roles that happen to be installed on the server. If you look at Figure 1, for instance, you can see that this particular server has the File and Storage Services role installed, as well as the Hyper-V role.
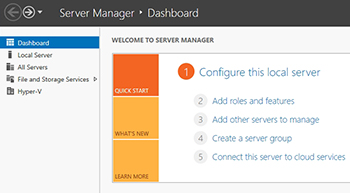 [Click on image for larger view.] Figure 1. The server's roles are listed in the console tree.
If you were to click on one of these role specific containers, Server Manager would display a screen filled with information related to the role. Clicking on the Hyper-V container for example, displays a screen containing information on servers, events, services, etc. You can see an example of this in Figure 2.
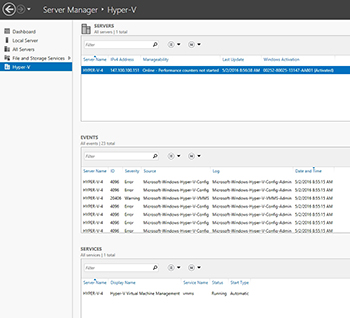 [Click on image for larger view.] Figure 2. Server Manager displays role specific information.
One of the really cool things that you can do with the Server Manager is to configure role-specific performance alerts. To do so, click on the role container to access the screen shown in the previous figure. Next, scroll down until you locate the Performance section. The Performance section contains a small drop down menu, located in the upper right portion of the interface. Select the Configure Performance Alerts option from this menu, as shown in Figure 3.
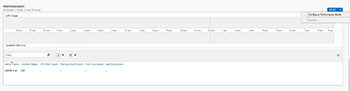 [Click on image for larger view.] Figure 3. Choose the option to configure performance alerts.
One of the things that you need to know about the Server Manager is that its performance monitoring capabilities are not the same as the Windows Performance Monitor. The Windows Performance Monitor is a far more advanced, and vastly more capable tool. Given this fact, it seems obvious that If you need to do any hardcore performance monitoring, you will want to use the Windows Performance Monitor or a comparable third party tool. However, there is more to the story.
Even lightweight performance monitoring is best handles by using the Windows Performance Monitor. The reason for this is that the Windows Performance Monitor and the Server Manager have two completely different purposes. The Performance Monitor is designed to show you what is going on with your server's performance right now. In contrast, the Server Manager only shows you the number of times when the server's resource consumption levels exceeded predetermined threshold values. Furthermore, the Server Manager is designed to display longer term trends rather than second by second performance metrics
So with that said, let's get back to the topic at hand. Choosing the previously mentioned Configure Performance Alerts option causes Windows to display the Configure Performance Alerts dialog box, shown in Figure 4.
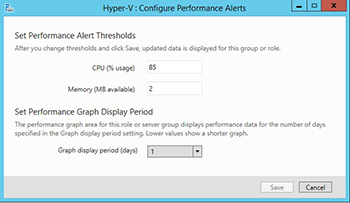 [Click on image for larger view.] Figure 4. This is the interface used to configure performance alerts.
As you can see in the figure, the interface is lightweight to say the least. Server Manager only allows you to set threshold values for memory and CPU usage. You can also specify the period of time that is shown on Server Manager's performance graph.
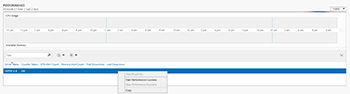
When you click Save, you may notice that no performance data is displayed. Depending on the server role that you are analyzing, the performance counters for the role may be turned off. If you look back at Figure 3, for example, you can see that the Counter Status is set to Off. You can fix this by right clicking on the listing for the server, and choosing the Start Performance Counters option from the resulting drop down list, as shown in Figure 5.
 [Click on image for larger view.] Figure 5. Choose the option to start the performance counters.
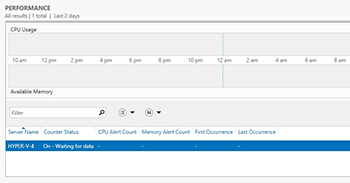
Upon starting the performance counters, it will take a while for the server to compile a sufficient amount of performance data. Once this data becomes available however, the server listing will display the number of CPU alerts, the number of memory alerts, the first occurrence of an alert, and the last occurrence of an alert. Although the server is still waiting on data, you can see the alert related columns in Figure 6.
 [Click on image for larger view.] Figure 6. The Server Manager is able to display performance alert counts on a per server basis.
About the Author
Brien Posey is a 22-time Microsoft MVP with decades of IT experience. As a freelance writer, Posey has written thousands of articles and contributed to several dozen books on a wide variety of IT topics. Prior to going freelance, Posey was a CIO for a national chain of hospitals and health care facilities. He has also served as a network administrator for some of the country's largest insurance companies and for the Department of Defense at Fort Knox. In addition to his continued work in IT, Posey has spent the last several years actively training as a commercial scientist-astronaut candidate in preparation to fly on a mission to study polar mesospheric clouds from space. You can follow his spaceflight training on his Web site.