In-Depth
Microsoft PowerPivot: Making Excel Analytics Work
A new component in SQL Server 2008 R2 gives users the autonomy to set up business intelligence functionality in Excel without taking control of the process away from IT.
PowerPivot is Microsoft's new self-service business intelligence (BI) product that seeks to make peace between IT and Excel users. PowerPivot is a component of SQL Server 2008 R2 that works with Excel 2010 and SharePoint Server 2010. It tries to do the heretofore unachievable: Provide power users with real BI capabilities that harness the data-analysis functionality of Excel, without the dangers and control issues that are normally part of the equation.
In the realm of IT, the use of Excel as a data-analysis tool is a near certainty. No matter how much IT -- and, indeed, BI -- professionals wish this phenomenon would go away, the reality is that it probably never will. Yes, data management in a spreadsheet carries with it inefficiencies and risk, but users are comfortable with Excel.
Spreadmarts: Good and Evil
User autonomy isn't a bad thing, but chaos is. The question with Excel in many organizations is whether users can use the software as a modeling and analysis tool but avoid using it to create "spreadmart" solutions -- spreadsheet-hosted data marts. To answer that question, let's enumerate the problems spreadmart solutions typically introduce.
Spreadmarts are suboptimal and sometimes downright dangerous for a number of reasons:
- Once data is imported into spreadsheets, it's typically never refreshed or updated, leading to stale, obsolete reports and analyses or burdensome and error-prone manual updates.
- Spreadmart "deployment" is typically achieved though e-mail attachment; this is both inefficient and insecure.
- Each user gets a private copy of the spreadmart, along with the ability to modify its data, possibly leading to publication of incorrect results and the liabilities associated with them.
- Should the spreadmart's queries be modified beyond their initial configuration, performance can be sorely lacking. Excel is a decent database client, but it's not a database engine -- and it's definitely not an online analytical processing (OLAP) or BI engine.
- If someone in a business unit designs a good spreadsheet-based analytics solution, it may become popular and even crucial to the business, requiring redesign using formal BI technology. But if IT doesn't know about this user-generated solution, it can't intervene for proper implementation.
Enter PowerPivot
In designing PowerPivot, Microsoft sought to address each of these issues. On the client, PowerPivot is a free downloadable add-in to Excel 2010 that allows users to import data from a dizzying array of sources. It allows data to be modeled, but not modified, and can then push that data to Excel for analysis using PivotTables, PivotCharts and Slicers (a filtering UI feature new to Excel 2010). This analysis is made possible by a true BI engine, running on the desktop and providing incredibly fast query response on data sets that can contain millions of rows.
But PowerPivot is not a client-only solution, and its server component is where typical spreadmart risk is mitigated. For example, PowerPivot solutions are published to SharePoint 2010 rather than via e-mail. This lets other users view and interact with them in the browser, where the solutions are still fully interactive and served by a SharePoint-managed server version of the desktop engine. Better yet, once PowerPivot solutions are published to SharePoint, their constituent data sources can be refreshed on a scheduled basis. Moreover, IT can monitor usage of these solutions and determine if one or more of them has popularity that's catapulting it past the PowerPivot scale.
Building the Model
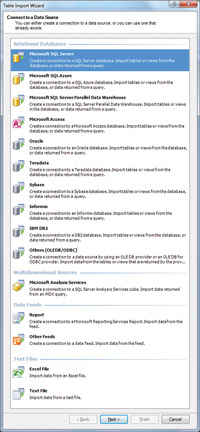
The PowerPivot workflow starts on the client. With the add-in installed, a PowerPivot tab is added to the Excel Ribbon interface. The leftmost button on that Ribbon tab opens the PowerPivot window, a sort of Microsoft Query on steroids, where data can be imported and modeled. Data sources include specialized options for major databases and data warehouse products, ATOM data feeds, flat files, spreadsheets and more. Figure 1 shows the Connect to a Data Source screen of the PowerPivot Table Import Wizard, which lists all external data source options.
[Click on image for larger view.] |
| Figure 1. PowerPivot lets users import data from almost any database, plus OLAP cubes, flat files, spreadsheets and OData feeds. |
If you look carefully at Figure 1, you'll notice one or two unlikely options. First of all, Analysis Services OLAP cubes can be used as a data source; this provides an excellent way to bring authoritative master data (like customer names, sales divisions and more) into a PowerPivot model. Second, Reporting Services (SSRS) reports, provided they were done with the SQL Server 2008 R2 version of SSRS, can be used as data sources as well. This is useful for two reasons. First, spreadmart makers use reports as data sources all the time; PowerPivot allows them to continue to do so but ensures that the reports can function as refreshable data sources instead of sources for static, cut-and-pasted data. Second, because SSRS can connect to data sources that other Microsoft BI tools can't connect to -- including SAP NetWeaver BI (also known as SAP BW) and Hyperion Essbase -- PowerPivot gains coveted connectivity to those data sources as well.
Further inspection of Figure 1 reveals that PowerPivot can import data from any database that has an Object Linking and Embedding database provider or Open Database Connectivity (ODBC) driver available. The SQL generated by PowerPivot to query those databases may not be as optimized as it would be for databases that are explicitly listed as compatible, but the data is nonetheless retrievable.
PowerPivot can also use as a data source any Excel spreadsheet region formatted as a table, and it can be linked dynamically so that if the content of the table is updated, the PowerPivot model is automatically updated as well.
PowerPivot can even import data from the Windows clipboard. And, not insignificantly, the "Other Feeds" option is compatible with any data source using Microsoft ATOM-based Open Data Protocol (OData) format.
Once tables are imported into the PowerPivot client, it's possible to define relationships between them. For tables that emanate from the same data source, these relationships are often defined automatically by PowerPivot itself. Where heterogeneous data sources are concerned, the relationships (meaning the data columns in each of two tables that can be used to associate those tables' data) can be specified through a simple dialog box, or can later be generated automatically in Excel.
Additionally, columns can be added to any table using an Excel-like formula language called Data Analysis Expressions (DAX). These formulas can perform anything from simple arithmetic operations in other columns in the table to complex statistical functions over a range of data filtered on values in a related table. What this all means is that sophisticated analytics can be crafted by power users who are already comfortable using Excel formulas in an advanced manner. What's also important is that using DAX formulas in PowerPivot models is completely optional.
The Model's Architecture
Going through the workflow of importing and relating various data tables and building calculations on their data in new columns produces the PowerPivot model. This model is then queried from Excel to render aggregations and drill-down detail. For example, if you imported a table with sales data in it, as well as reference data tables with geographic and time data, this could allow you to build PivotTables and charts in Excel that would permit you to see sales aggregated by year and country, with the ability to drill down any year into calendar quarters and any country into states, provinces and cities.
If the process of importing data from numerous external sources and then performing optimized drill-down analysis of that data sounds familiar, it should: This is what SQL Server Analysis Services and OLAP make possible. And the good news is that PowerPivot is Analysis Services, albeit a special version with a new storage engine (which we'll discuss shortly). So, users get an industry-standard technology but need not be aware of esoteric OLAP concepts such as cubes, measures, dimensions and aggregations. The beauty of PowerPivot is that users think they're just importing tables and building a "model," but it turns out that model is an Analysis Services cube. And that means that it can be queried, managed and updated in a rigorous way -- it's not just a spreadsheet.
Although PowerPivot is based on Analysis Services technology, it uses a radically different storage technology than the multidimensional OLAP storage used by the full Analysis Services product. Instead of storing things multidimensionally, PowerPivot stores data in a columnar fashion, so all values for a given column or field are adjacent to each other. This provides high rates of compression, because values in the same column tend to be relatively close, or even identical, in value. This compression in turn allows the entire cube to be loaded into memory, which provides for incredibly fast query performance, without the need for typical Analysis Services optimizations like partitioning or pre-calculated aggregations.
Using the Model
Once the model is built, the PowerPivot user simply clicks a button on the PowerPivot client application Ribbon, which creates a data source in the spreadsheet (pointing to its own embedded PowerPivot model), and then generates empty PivotTable and chart objects that are bound to that data source. Rather than the standard PivotTable field list, the user sees one that, instead of listing measures, dimensions and other Analysis Services objects, enumerates a simple list of all the model's tables with each of their columns indented beneath them. From here, the user can drag columns into the Values, Row Labels, Column Labels and Report Filter areas just as they could with a conventional PivotTable.
People who build a lot of PivotTables know that use of Report Filters can make PivotTables very compelling to
consumers of information. The problem, however, is that the filter UI, a drop-down checklist, is less than user-friendly. In response to this, Excel 2010 introduced a new feature called Slicers, which allows column values to be displayed in expanded, attractive lists that ride up the side -- and along the top -- of the PivotTables and charts in a spreadsheet. Creating Slicers is achieved by simply dragging columns into the Slicers Vertical and Slicers Horizontal areas in the PowerPivot Task Pane. Slicers are an Excel feature designed by the Analysis Services team for use with PowerPivot models, but they can, in fact, be used with non-PowerPivot PivotTables as well.
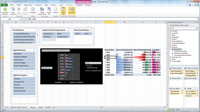
By default, if your PowerPivot spreadsheet contains both a PivotTable and chart -- even if they have different content -- the Slicers will affect both. Slicers are also contextual: If making a selection in one renders invalid certain values in another, then those other values will gray out. For example, imagine that in our PowerPivot model we have no data for France in the year 2005. Selecting 2005 in a year Slicer would disable the selection of France in another Slicer built on country (and vice-versa). Figure 2 depicts a spreadsheet built on a PowerPivot model.
[Click on image for larger view.] |
| Figure 2. PowerPivot analysis in Excel. |
Client, Yes, but Server Too
Having such power on the desktop PC is great, but the real value of PowerPivot is realized when spreadsheets containing its models, along with the PivotTables and charts built atop those models, are published to SharePoint. Once deployed to SharePoint, PowerPivot models can actually be viewed in the browser, and users doing so retain the ability to perform drill downs and make filter selections with Slicers. This is done using only AJAX Web technology -- no plug-ins, ActiveX or Java components are used.
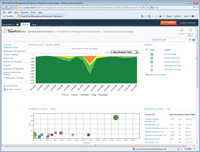
But the server story benefits IT as much as it does users. Once a PowerPivot solution is published to SharePoint, IT can schedule refreshes of its data sources and monitor usage and server health metrics in a very precise way using the PowerPivot IT dashboard, shown in Figure 3. This way, IT can actually have insight into how these solutions may be performing and affecting operation of the SharePoint farm. (Performance over time is visualized in the top chart in Figure 3.) Because the server component of PowerPivot -- which is invoked when users browse PowerPivot spreadsheets in the browser -- is a SharePoint-managed service, instances of it can be spun up or shut down, depending on demand.
[Click on image for larger view.] |
| Figure 3. The PowerPivot IT dashboard, with performance chart above and spreadsheet usage statistics below. |
Finally, PowerPivot solutions whose popularity grows continuously can be identified proactively -- spreadsheet usage over time is visualized in the bubble chart on the bottom of Figure 3 -- thus allowing IT to select those cubes for more formal implementation, using the full version of Analysis Services, by BI professionals when required.
To Use or Not to Use?
PowerPivot solves almost every major problem associated with typical spreadmart solutions. It gives users a powerful columnar, in-memory BI engine to do real analytics in a self-service manner. It keeps the source data locked down. It allows collaboration and sharing using a central server, rather than e-mail, thereby providing security and scalability, enabling the data to be refreshed, and allowing IT to manage performance and have insight into which user-generated BI solutions are meeting company needs. The self-service and reliable nature of PowerPivot eases delivery and backlog burdens on IT, and the SharePoint integration gives IT the control, management and monitoring capabilities that normally accompany self-service solutions.
All this gives PowerPivot the potential to change the BI game significantly. End users will have greater capabilities, which they will be empowered to implement. IT, meanwhile, can meet its responsibility to manage performance and stability, and to ensure that data is properly and centrally managed.