In-Depth
First Look: Microsoft Azure Monitor Preview
Based on an evaluation of the preview release, Microsoft's new Azure Monitor will give administrators analytics, troubleshooting data, metrics and logs.
Microsoft has recently begun promoting its Azure public cloud as the best platform for running workloads at scale. Of course, running workloads at scale isn't just about having a huge collection of hardware at your disposal, but also about being able to manage, monitor and automate the workload in a way that makes it practical to run the workload at scale. The company's solution to the challenge of workload monitoring is Microsoft Azure Monitor.
The new service extends some of the existing monitoring capabilities offered to Azure customers but also provides additional metrics and logs in the Azure portal. Microsoft is also giving administrators deeper views of the state and performance of customers' resources. Revealed at last fall's Ignite event in Atlanta, Microsoft said Azure Monitor provides analytics, troubleshooting information and a common dashboard in the portal. Microsoft is also making the APIs available, which will allow integration with other tools.
Although not yet ready for production use, the public preview of Azure Monitor is available for evaluation. To access the Azure Monitor preview, log into the Azure console and click on Monitoring. Currently, Monitoring is not included among the list of Azure services. However, switching to the new Azure Management Portal causes the Monitoring option to be revealed.
The Azure Monitor interface consists of several tabs, which some of the Microsoft documentation refers to as blades. The four primary tabs are Activity log, Metrics, Diagnostic logs and Log search.
The Activity Log
The Activity log is exactly what its name implies. It's a log of the activities performed recently. The Insights (listed in the upper-right corner) are limited to the last 24 hours. However, you can change the Timespan to cover a broader period of time so that a number of operations are displayed (see Figure 1).
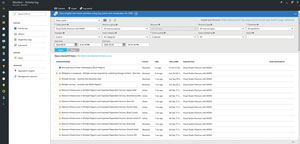 [Click on image for larger view.]
Figure 1. Changing the Timespan causes more operations to be displayed.
[Click on image for larger view.]
Figure 1. Changing the Timespan causes more operations to be displayed.
In this particular case, I chose to use a custom Timespan. Azure Monitor lets you display up to 90 days of data. Of course, long-duration Timespans are likely to reveal large numbers of operations. Fortunately, you can filter the query results by Subscription, Resource group, Resource, Resource type, Operation, Event category, Event severity and Event initiated by. You can also use the Search box to search for specific information.
These features are helpful in situations in which you're looking for a specific piece of information. However, the Activity log can also create a very concise view of recent activity. If I wanted to keep track of the number of service health issues that had occurred within the last month, I could set the Timespan to Last month, and set the event category to Service health. Clicking Apply would reveal the Service health issues that had occurred within the last month, but I can actually take things a step further.
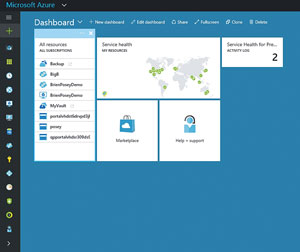
There are a series of icons in Figure 1 just to the right of the Select query dropdown. If you save your query and then click the Pin to Dashboard icon, then Azure will create a dashboard tile reflecting the query. A large tile labeled Service health (see Figure 2) is a default tile that displays the current health of the various Azure regions. Just to the right of this tile, however, is a tile named Service Health for Previous Month. This is a custom tile I created through Azure Monitor. The No. 2 indicates there have been two Service health issues within the last month. Clicking on the tile loads Azure Monitor and causes the query results to be displayed.
 [Click on image for larger view.]
Figure 2. You can create live tiles based on Activity log queries.
[Click on image for larger view.]
Figure 2. You can create live tiles based on Activity log queries.
Metrics
The Activity log is a text-based collection of logging information that really isn't dissimilar from the Windows Server Event Logs. As useful as this type of logging information can be, text isn't always the best medium for conveying data. Sometimes graphical visualizations do a better job of conveying information. This can be especially true in situations in which there are vast quantities of information that cannot easily be digested in text form. This is where the Metrics tab comes into play. The Metrics tab is designed to provide a graphical representation of monitoring data.
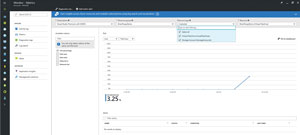
The Metrics tab (see Figure 3) contains fewer filtering options than the Activity log. The available filters include Subscription, Resource group, Resource type and Resource. After selecting a Subscription and a Resource group, you're able to select a Resource type and a specific Resource of the selected type. Upon doing so, you can view key metrics for the Resource.
 [Click on image for larger view.]
Figure 3. Azure Monitor can display key performance metrics for various resources.
[Click on image for larger view.]
Figure 3. Azure Monitor can display key performance metrics for various resources.
I've selected a Resource group named BrienPoseyDemo. This Resource group contains a couple of virtual machines and their corresponding storage accounts, which is why the Resource type list contains check boxes labeled Virtual Machine and Storage Account. You'll also notice I've selected a specific Virtual Machine within the Resource dropdown list. Because I've selected a Virtual Machine, I can view metrics such as CPU percentage, Disk read, Disk write, Network In and Network Out. Had I selected a Storage Account, the list of available metrics would have included storage-oriented metrics.
Although the Metrics screen is set up to display performance data, you can also display performance information on your dashboard. Like the Activity log screen, the Metrics screen contains an icon for pinning a query to the dashboard.
Incidentally, it can take some time before Azure begins to populate the graph, so don't worry too much if your graph initially appears to be blank. Just try periodically refreshing the display.
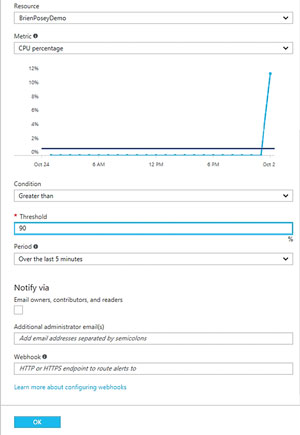
In Figure 3 there's an icon labeled Add metric alert, an alerting mechanism that allows administrators to be notified if a resource such as a virtual machine is performing poorly. An alert that's triggered if 90 percent of the virtual machine's CPU resources remain in use for more than five minutes (see Figure 4).
 [Click on image for larger view.]
Figure 4. Alerts can notify the administrative staff when a resource exceeds a predefined threshold.
[Click on image for larger view.]
Figure 4. Alerts can notify the administrative staff when a resource exceeds a predefined threshold.
There's nothing overly difficult about creating alerts, but there are two things you must keep in mind. First, you'll be required to assign a name to each alert you create. Second, alerts are configured on a per-resource basis. The alert described in Figure 4, for example, applies specifically to the selected virtual machine.
Diagnostic Logs
The third major component to Azure Monitor is the Diagnostic log section. Azure allows you to save operational logging data for a resource to a storage account. You also have the option of sending logging information to Microsoft's log analytics engine or to an event hub.
The Diagnostic log interface looks very similar to the Metrics interface. As was the case with the Metrics interface, there are dropdown lists for Subscription, Resource group, Resource type and Resource. However, there are a few key differences between the Diagnostic logs and Metrics. For starters, Diagnostic logs are not graphical and the interface doesn't contain a link for creating alerts. More important, you can only retrieve diagnostic logging data for resources for which diagnostic logging has been enabled. Otherwise, the Resource types will be grayed out.
Log Search
The fourth major component to Azure Monitor is Log search. Azure Monitor's native capabilities are undeniably useful for those who run workloads in the Azure cloud. However, Microsoft intends for Azure Monitor to eventually become the go-to tool for monitoring resources both in the public cloud, and in your own datacenter. This is where Log search comes into play.
Log search allows Azure Monitor to become a single-pane-of-glass monitoring solution for on-premises and cloud resources. In fact, Microsoft demoed this capability at Ignite during the opening keynote session.
Microsoft integrates the Operations Management Suite (OMS) into Azure, and exposes it through the Log search feature. All you have to do is connect Log search to a data source.
Customers can create an OMS portal from within Azure. The actual monitoring data exposed through this portal varies depending on which data source you choose to use. Azure itself can act as a data source, giving you the ability to monitor Azure virtual machines, but Storage account logs, Computers and System Center Operations Manager can each be used as data sources, as well.
Just choose Computers as a data source. Azure prompts you to download an agent, either for Windows or for Linux. This agent allows computers on your private network to be monitored by Azure.
Similarly, designating System Center Operations Manager (SCOM) as a data source causes those resources managed by SCOM to be exposed through the Azure OMS portal. In fact, during the previously mentioned Ignite demo, Microsoft showed how this technique can be used to monitor VMware resources through Azure. Microsoft published more information about connecting Azure Monitor to SCOM.
Although this evaluation is based on the preview release, Azure Monitor looks promising, because it will make it possible to monitor on-premises and public cloud resources through a single tool. These dashboard views make it possible to gauge the health of your resources at a glance.
About the Author
Brien Posey is a 22-time Microsoft MVP with decades of IT experience. As a freelance writer, Posey has written thousands of articles and contributed to several dozen books on a wide variety of IT topics. Prior to going freelance, Posey was a CIO for a national chain of hospitals and health care facilities. He has also served as a network administrator for some of the country's largest insurance companies and for the Department of Defense at Fort Knox. In addition to his continued work in IT, Posey has spent the last several years actively training as a commercial scientist-astronaut candidate in preparation to fly on a mission to study polar mesospheric clouds from space. You can follow his spaceflight training on his Web site.