Windows Server How-To
How To Use the Windows Reliability Monitor
The feature, found in Windows 8.1 and Windows Server 2012, can help troubleshoot issues by providing a history of the OS.
In my opinion, the Reliability Monitor is perhaps the most underrated tool that is included with the Windows operating system. The Reliability Monitor (which comes with server and desktop versions of Windows) can give you insight into the operating system's history. Let me explain.
I have worked in IT for well over 20 years and in that time one thing that I have learned is that for whatever reason, people lie to the IT department on a regular basis. How many times have you had someone tell you that they don't know why the system went belly up? For me there is nothing more frustrating than getting bad information about a system that I am trying to fix.
This is where the Reliability Monitor comes into play. As the name implies, the Reliability Monitor tracks the system's reliability over time and shows events that could potentially compromise that reliability.
The method used to access the Reliability Monitor varies depending on the version of Windows that you are using. For systems that are running Windows 8, 8.1, Windows Server 2012, or 2012 R2, you can access the Reliability Monitor by accessing the charms bar, clicking on the Search icon, and then entering Reliability History into the search box. The search results include a View Reliability History link that you can click to launch the Reliability Monitor.
 [Click on image for larger view.] Figure 1. Enter Reliability History into the Search box.
Hopefully when you launch the Reliability Monitor, you will see all of the reliability data that the system has collected. However, there is a chance that you will see a message like the one shown in Figure 2. As you can see in the figure, you have to turn on RACTask before the Reliability Monitor will be able to collect monitoring data.
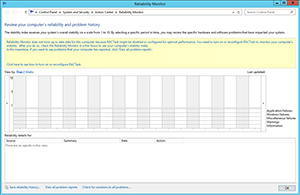 [Click on image for larger view.] Figure 2. RACTask must be enabled in order for the Reliability Monitor to work.
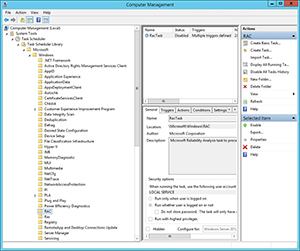
To enable RACTask, open the Computer Management console and then navigate through the console tree to Computer Management (Local) | System Tools | Task Scheduler | Task Scheduler Library | Microsoft | Windows | RAC, as shown in Figure 3.
 [Click on image for larger view.] Figure 3.
Open the Computer Management console and then navigate through the console tree to Computer Management (Local) | System Tools | Task Scheduler | Task Scheduler Library | Microsoft | Windows | RAC.
Now, right click on RacTask (in the console's upper center pane) and choose the Enable option from the shortcut menu. In some cases, the RacTask appears not to exist. If you don't see RacTask listed then right click on the RAC folder and select the View | Show Hidden Tasks commands from the shortcut menu. This should cause RacTask to be revealed.
Of course all of this raises the question of what good the Reliability Monitor is if it has not collected the data that you need. The Reliability Monitor is enabled by default on desktop systems. You won't have to do anything ahead of time to enable data collection. You only have to plan ahead and enable data collection on servers.
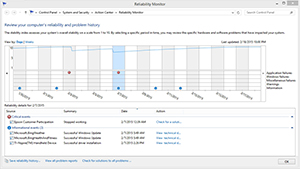
You can see what the Reliability Monitor looks like in Figure 4. As you can see in the figure, there is a blue line on the graph that lists the system's reliability on a scale from 1 to 10. Any time that certain events occur the reliability is lowered. These events include application failures, Windows failures, miscellaneous failures and warnings.
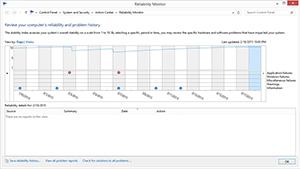 [Click on image for larger view.] Figure 4. The reliability score is plotted on a graph.
Another thing that you will notice about the figure above is that there were two events that impacted reliability. Both of these events were errors and they are flagged in the Application Failures row. To see more information about an event, simply click on the day on which the event occurred. The information that is displayed depends on the error, but in the case of an application error you will usually see the name of the application and a link that you can click on to check for a solution. You can see what this looks like in Figure 5.
 [Click on image for larger view.] Figure 5. The Reliability Monitor lists the date and time of the application error.
As you look at the figure above, you will undoubtedly notice the information events listed below the error. These are update events. You can use these informational events to figure out what types of things have recently been installed on the system, which can be a huge help when troubleshooting a problem.
As you can see, the Reliability Monitor is an awesome tool. It gives you a lot of great information without requiring you to do much work.
About the Author
Brien Posey is a 22-time Microsoft MVP with decades of IT experience. As a freelance writer, Posey has written thousands of articles and contributed to several dozen books on a wide variety of IT topics. Prior to going freelance, Posey was a CIO for a national chain of hospitals and health care facilities. He has also served as a network administrator for some of the country's largest insurance companies and for the Department of Defense at Fort Knox. In addition to his continued work in IT, Posey has spent the last several years actively training as a commercial scientist-astronaut candidate in preparation to fly on a mission to study polar mesospheric clouds from space. You can follow his spaceflight training on his Web site.