Windows Server How-To
Pinpoint Windows Server Domain Controller Issues with the DCDiag Tool
Having issues with domain controllers? Use this native tools to pinpoint exactly where it.
One of the most helpful native tools for troubleshooting problems with domain controllers is DCDiag. In this article, I will show you the basics of using this helpful tool.
DCDiag was introduced early on, and has been around since at least Windows Server 2003. The utility still exists in Windows Server 2012 R2. In order to use it, you will need to open an elevated Command Prompt window. You can do this in Windows Server 2012 R2 by right clicking on the Start Button and choosing the Command Prompt (Admin) command from the shortcut menu.
DCDiag can be run remotely, but for the purposes of this article, I am assuming that you are logged directly into a domain controller and that your account has Domain Admin privileges.
So with that said, you can get a basic health report by simply entering the DCDiag command without using any switches. This technique generally works fine, but the output can be overwhelming in situations in which a lot of errors exist. For example, when I ran the command in my own organization, the utility produced a huge stream of errors (as shown in Figure 1), simply because I had shut down a redundant domain controller to save power.
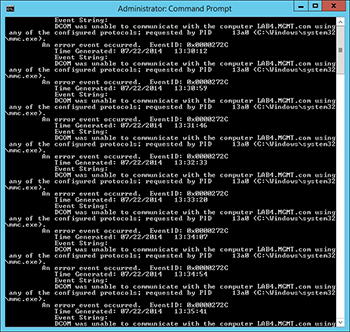 [Click on image for larger view.] Figure 1. The DCDiag utility can produce an overwhelming number of errors.
Often times if you are using the DCDiag tool, the goal will be to check the health of a specific domain controller (as opposed to trying to evaluate the Active Directory as a whole). In these types of situations, you can target a specific domain controller by appending the /S switch and the domain controller name to the DCDiag command, as shown in Figure 2.
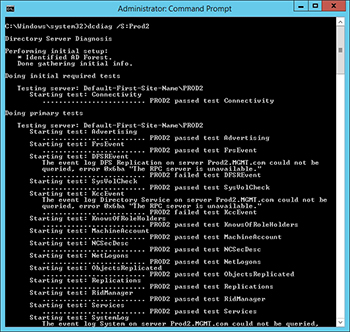 [Click on image for larger view.] Figure 2. You can run DCDiag against a specific domain controller.
It is worth noting that even if you target a specific domain controller for testing, you may see error messages related to other domain controllers in the report if there are issues that are disrupting communications between the specified domain controller and another domain controller on your network.
Although it can be handy to test a single domain controller, doing so may be impractical unless you suspect that the domain controller that you are testing is the source of your problems. Imagine a large organization with hundreds of domain controllers for instance. You probably wouldn't want to test every domain controller individually.
I will be the first to admit that a large organization will typically be running monitoring software that will point you to the source of a problem, but just to play devil's advocate, let's forget about any external monitoring for a moment and pretend that we need to track down the source of a problem using only the DCDiag tool.
The way that you would go about tracking down an error on a large network depends on whether or not you had been able to isolate the error or not. For example, if you knew that the error was occurring in a specific Active Directory site then you could append the /A switch to the DCDiag command. This causes all of the domain controllers in the current Active Directory site to be tested. If on the other hand you didn't know for sure which site was having the problems, you could use the /E switch to test all of the domain controllers in the enterprise.
If you are going to perform large scale testing then there are a couple of things that I recommend doing. First, you might consider using the /Q switch. The /Q switch causes only the error messages to be displayed, as shown in Figure 3. That way you won't have to hunt through a long text document as you try to track down an error.
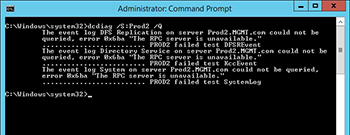 [Click on image for larger view.] Figure 3. Appending the /Q switch hides everything except for error messages.
Another thing that I recommend doing is using the /F switch to redirect the output to a log file. That way, you can go back and look at the data later on. To use the /F switch, just append a colon and a path and filename. You can see an example of this in Figure 4.
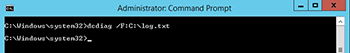 [Click on image for larger view.] Figure 4. You can redirect the report to a log file.
If you do happen to find an error then you can get more information about the error by using the /V switch. The /V switch provides verbose output.
As you can see, the DCDiag tool is relatively easy to use. You can access the full documentation for the tool here.
About the Author
Brien Posey is a 22-time Microsoft MVP with decades of IT experience. As a freelance writer, Posey has written thousands of articles and contributed to several dozen books on a wide variety of IT topics. Prior to going freelance, Posey was a CIO for a national chain of hospitals and health care facilities. He has also served as a network administrator for some of the country's largest insurance companies and for the Department of Defense at Fort Knox. In addition to his continued work in IT, Posey has spent the last several years actively training as a commercial scientist-astronaut candidate in preparation to fly on a mission to study polar mesospheric clouds from space. You can follow his spaceflight training on his Web site.