Windows Server How-To
Configuring Hyper-V Resource Metering
Here's how to check the resource allocation for one or a collection of virtual machines.
Windows Server 2012 Hyper-V contains a resource metering mechanism that makes it possible to track system resource usage either for a virtual machine or for a collection of virtual machines. Doing so can help you to keep track of the resources consumed by virtual machine collections. This information could be used to facilitate chargebacks (although Hyper-V does not contain a native chargeback mechanism).
Resource metering is not enabled by default. You can enable resource metering through PowerShell by entering the following command:
Get-VM <virtual machine name> | Enable-VMResourceMetering
By default, Hyper-V collects resource metering statistics once every hour. You can change the collection frequency, but it is a good idea to avoid collecting metering data too frequently because doing so can impact performance and generate an excessive amount of metering data. If you want to change the collection frequency you can do so by using this command:
Set-VMHost –ComputerName <host server name> -ResourceMeteringSaveInterval <HH:MM:SS>
As you look at the command above, you will notice that the collection frequency is being set at the host server level. You cannot adjust the frequency on a per VM basis. You can see what this command looks like in figure 1.
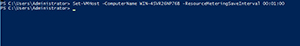 [Click on image for larger view.] Figure 1. You can change the resource metering collection frequency.
When you enable resource metering, there are a number of different resource usage statistics that are compiled. These statistics include:
- The average CPU usage (measured in MHz)
- The average physical memory usage (measured in MB)
- The minimum memory usage (measured in MB)
- The maximum memory usage (measured in MB)
- The maximum amount of disk space allocated to a VM
- The total inbound network traffic (measured in MB)
- The total outbound network traffic (measured in MB)
The easiest way to view a virtual machine's resource usage is to enter the following command:
Get-VM <virtual machine name> | Measure-VM
This command will display all of the available metering data for the virtual machine that you have specified.
Similarly, resource metering data can be displayed for all of the virtual machines that are running on the host server. If you want to see monitoring data for all of the virtual machines, you can acquire it by running this command:
Get_VM | Measure-VM
You can see what the output looks like in figure 2.
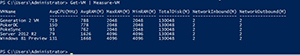 [Click on image for larger view.] Figure 2. This is what the resource metering output looks like.
Often times administrators are interested in specific aspects of resource consumption. For example, if a particular host server had limited network bandwidth available then an administrator would probably be interested in seeing the amount of network traffic that each virtual machine was sending and receiving. Conversely, if that same server had far more processing power than what would ever be needed by the virtual machines that are running on it, then the administrator probably would not need to monitor the average CPU usage.
Although you cannot turn data collection on or off for individual statistics, you can configure PowerShell to display only the statistics that you are interested in. The key to doing so is to know the object names that PowerShell assigns to each statistic. You can see the object names by entering the following command:
Get-VM | Measure-VM | Select-Object *
The column on the left side of the output lists the names that PowerShell uses for the individual statistics. You can see what this looks like in figure 3.
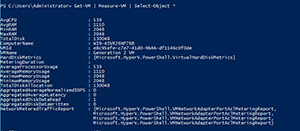 [Click on image for larger view.] Figure 3. You can get the object names from the column on the left.
There are a couple of things that you might have noticed in the figure above. First, there are more objects than what are displayed by default. Second, there are more objects than what I listed earlier. The reason for this is that these screen captures came from a server running Windows Server 2012 R2 Preview. Microsoft is extending the Resource Metering feature in Hyper-V 2012 R2 to include additional metering objects. In this article however, I only listed the objects that are available today.
With that in mind, let's suppose that you only wanted to list the maximum memory consumption for each VM. You could do so by using this command:
Get-VM | Measure-VM | Select-Object VMName, MaxRAM
You can see the output in figure 4. Keep in mind that you can adapt this command to display any combination of objects that you want.
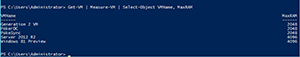 [Click on image for larger view.] Figure 4. PowerShell can display specific resource metering data.
As you can see, resource metering is useful for tracking resource consumption. It can also be useful for performing chargebacks, although there is no native Hyper-V chargeback mechanism.
About the Author
Brien Posey is a 22-time Microsoft MVP with decades of IT experience. As a freelance writer, Posey has written thousands of articles and contributed to several dozen books on a wide variety of IT topics. Prior to going freelance, Posey was a CIO for a national chain of hospitals and health care facilities. He has also served as a network administrator for some of the country's largest insurance companies and for the Department of Defense at Fort Knox. In addition to his continued work in IT, Posey has spent the last several years actively training as a commercial scientist-astronaut candidate in preparation to fly on a mission to study polar mesospheric clouds from space. You can follow his spaceflight training on his Web site.