In-Depth
Operations Management Suite Gives Admins a Deeper View
Office 365 is the latest component Microsoft is adding to its new OMS, which provides in-depth usage and monitoring reports.
Microsoft last year introduced its new Operations Management Suite (OMS), an online service for managing and monitoring enterprise cloud resources. The tool is designed to help administrators correlate and respond to log data, to orchestrate repetitive tasks, and to detect and mitigate security risks.
The suite is a collection of Microsoft services for organizations managing operations in public datacenters, such as Microsoft Azure and Amazon Web Services (AWS), but also hybrid infrastructures that include both public cloud and on-premises datacenter resources. OMS works as a standalone solution or it can be integrated with System Center Operations Manager, a capability Microsoft enabled last year.
Recently, Microsoft introduced an Office 365 component for OMS. Although this Office 365 solution is a work in progress and is currently available only as a preview release, it's already possible to get a sense for how this solution will help administrators evaluate Office 365 usage.
3 Key Requirements
To use the Office 365 solution with OMS, there are three requirements to which to adhere. First, you need an OMS subscription, which you can obtain as a free trial here.
Second, you must also have an Office 365 subscription, and you need to be a global admin within Office 365. Otherwise, you won't have the permissions necessary to connect Office 365 to OMS.
And, finally, your Office 365 account must be an organizational account. This requirement sounds somewhat odd, but this is presumably Microsoft's way of saying you won't be able to connect OMS to an Office 365 account licensed for home use. This requirement makes sense when you consider most home users probably don't have a need for enterprise-grade monitoring of their Office 365 accounts.
The Configuration Process
Configuring OMS to work with Office 365 is a relatively straightforward process. First, log into OMS, and click on the Solutions Gallery tile (see Figure 1).
 [Click on image for larger view.]
Figure 1. Click on the Solutions Gallery tile.
[Click on image for larger view.]
Figure 1. Click on the Solutions Gallery tile.
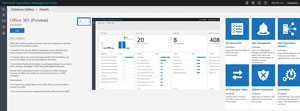
The Solutions Gallery contains a series of tiles representing the various services with which OMS is able to work. Click on the Office 365 (Preview) tile, and it brings up the Office 365 (Preview) details screen (see Figure 2). Administrators can add the Office 365 solution to OMS by clicking on the Add button. This will return you to the previous screen.
 [Click on image for larger view.]
Figure 2. Click the Add button to add the Office 365 solution to OMS.
[Click on image for larger view.]
Figure 2. Click the Add button to add the Office 365 solution to OMS.
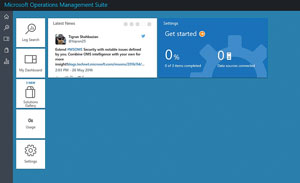
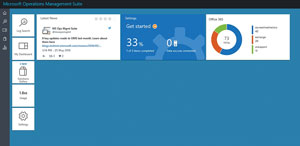
The home screen includes a large Get Started tile, and this tile includes an arrow icon. Click on this icon, which takes you to the Get Started screen.
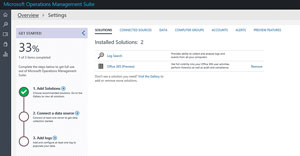
In the console, it appears as though setting up OMS is a three-step process, but actually there are only two steps to setting it up for Office 365.
The second step in the process is to connect a data source. To do so, click on the Connect a Data Source icon (see Figure 3), which brings you to the Connected Sources screen.
 [Click on image for larger view.]
Figure 3. Click on the Connect a Data Source icon.
[Click on image for larger view.]
Figure 3. Click on the Connect a Data Source icon.
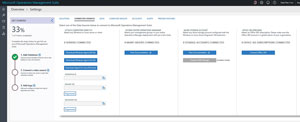
The Connected Sources screen allows you to establish connectivity between OMS and your various data sources. OMS provides a number of different connectivity options (see Figure 4).
 [Click on image for larger view.]
Figure 4. The different connectivity options in OMS.
[Click on image for larger view.]
Figure 4. The different connectivity options in OMS.
You can use the Connected Sources screen to establish connectivity between OMS and Office 365. OMS is providing the opportunity to connect to individual servers (and to download agents that can be installed onto those servers), and to connect management groups and storage accounts. There's also an option to connect to Office 365. It's likely your environment will look a little bit different than what you see in Figure 4, because the screen's contents and configuration options vary based on which solutions are installed.
To connect Office 365, click on the Connect Office 365 button. Doing so will cause OMS to open a new window, which prompts you to log into Office 365. Be sure to enter the credentials for your Office 365 global admin account rather than entering the credentials for your own user account.
Upon signing into Office 365, you'll see a screen in which Office 365 indicates it needs permission to read activity data and service health information for the organization. Office 365 also needs permission to enable single sign-on and to read user profiles. Assuming you're willing to grant the necessary permission, click the Accept button. It takes about a minute for the connection to be established. Although the connection is technically configured at this point, it takes a few hours for OMS to begin compiling data from Office 365.
The next time you return to the OMS dashboard, you'll notice a new Office 365 tile. Assuming a sufficient amount of time has passed, this tile will also display an aggregate usage summary for Office 365. For example, Figure 5 shows 73 total activities have been logged. These activities reflect my Office 365 subscription as a whole, not just my own usage (I have a really small organization). The chart categorizes these activities as being related to Azure Active Directory (AD), Exchange and SharePoint. It shows most of the activity has been related to Azure AD, with 42 activities. There were also 20 Exchange events and 11 SharePoint events.
 [Click on image for larger view.]
Figure 5. The OMS dashboard now contains an Office 365 tile.
[Click on image for larger view.]
Figure 5. The OMS dashboard now contains an Office 365 tile.
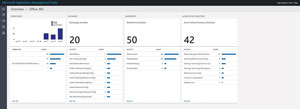
You can get more information on your organization's Office 365 usage by clicking on the Office 365 tile. Doing so causes the console to display the Office 365 dashboard (see Figure 6).
 [Click on image for larger view.]
Figure 6. The Office 365 dashboard.
[Click on image for larger view.]
Figure 6. The Office 365 dashboard.
There are several things you'll probably notice about this dashboard. For starters, there are 20 Exchange activities, 50 SharePoint activities, and 42 Azure AD activities. That's a total of 112 activities, which of course far exceeds the 42 activities displayed in the previous screen capture. The reason is the dashboard is automatically updated to reflect new activity (although these updates do not occur in real time), and a substantial amount of activity occurred between the time the screen captures were taken.
Another thing you might notice is there's a message in the upper-right corner indicating the dashboard is based on the last seven days' worth of data. As such, the usage statistics you see are relatively current, and do not reflect the full history of the Office 365 subscription.
The dashboard also contains a chart showing the number of activities that have occurred on each day. This chart, which is located in the upper-left pane, displays the total activity count and then shows the distribution of those activities over the last week. I have no explanation as to why the chart indicates 114 activities have occurred, when the sum total of activities shown only adds up to 112. The software is still in preview release, so it's possible Microsoft still has some bugs to work out.
The pane on the lower-left portion of the chart shows the operations by user. Normally, each user's e-mail address would be displayed, along with a count of the user's activities over the last week. In this case, the e-mail addresses were shown in the console, but were edited out of the screen capture.
The remaining panes along the top row of the dashboard break down user activity by area, as well as the Exchange, SharePoint and Azure AD usage.
Also, activities are listed by activity type. For example, some of the more frequent Exchange Server-related activities include using the Set-Mailbox cmdlet and the Set-TransportConfig cmdlet. It's worth noting, however, that when an administrator performs actions through the Exchange Admin Center, the console is executing Windows PowerShell commands in the background. As such, you can't look at the dashboard's output and assume someone has been managing Exchange Server through PowerShell, because the dashboard takes GUI-based administrative activities into account.
Just as the Exchange Server activities are listed by activity type, so, too, are SharePoint and Azure AD activities. For example, most of the SharePoint activities listed are related to files being uploaded to a SharePoint document library, or files that already exist within a SharePoint document library being accessed. In the case of Azure AD, the vast majority of the activities correspond to the authentication and logon process.
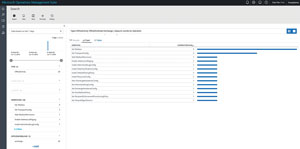
Each column shown in Figure 6 contains a See All link. Clicking on this link takes you to a dashboard screen specific to the selected product. The information displayed on this screen varies based on the data that exists, but it provides a more verbose view of the pdashboard screen (see Figure 7).
 [Click on image for larger view.]
Figure 7. The dashboard displayed when you click on the See All link.
[Click on image for larger view.]
Figure 7. The dashboard displayed when you click on the See All link.
At first glance, this screen probably doesn't seem all that special. After all, it provides basically the same information displayed on the previous screen, although it does provide computer names and IP addresses associated with certain types of activity.
The main reason why Microsoft provides this view is it contains options to save or export your data. More important, the screen also contains an option for creating an alert rule.
Alerts are based on the activity counters you've already seen. OMS allows you to generate an informational, warning or critical alert if the activity level exceeds a certain threshold (it's up to you to determine the appropriate threshold value). By default, OMS checks for alert conditions every 15 minutes.
If an alert does occur, OMS can take three actions: sending an e-mail notification, launching a Webhook URL (with an optional JSON payload) or executing a Runbook. Using the Runbook option, however, requires an Azure subscription.
Standardize Your Approach
The Office 365 solution of OMS can help you to determine how your users are using Office 365. More important, the Office 365 solution can help you to standardize your approach to management and monitoring your organization by using a single tool to interact with multiple connected resources.
About the Author
Brien Posey is a 22-time Microsoft MVP with decades of IT experience. As a freelance writer, Posey has written thousands of articles and contributed to several dozen books on a wide variety of IT topics. Prior to going freelance, Posey was a CIO for a national chain of hospitals and health care facilities. He has also served as a network administrator for some of the country's largest insurance companies and for the Department of Defense at Fort Knox. In addition to his continued work in IT, Posey has spent the last several years actively training as a commercial scientist-astronaut candidate in preparation to fly on a mission to study polar mesospheric clouds from space. You can follow his spaceflight training on his Web site.