Denny's SQL Secrets
Troubleshoot Slow-Running Queries In SQL Server
Denny breaks down how to identify and fix speed issues in multiple versions of SQL Server.
- By Denny Cherry
- 12/11/2013
One of the most common problems when running SQL Servers is slow queries. The help desk or database team usually hears that described as the application is slow or the database is slow. In the worst case, the user gets a timeout error message.
The key in all of these cases is to first identify the slowly running queries on SQL Servers. If you aren't that familiar with SQL Server, this may seem difficult, but it's actually pretty easy. The method you'll use to identify the slowly running queries will depend on the version of SQL Server you're using.
If you're using SQL Server 2008 R2 through SQL Server 2014, you have the option of two different methods. The first is SQL Server Extended Events. These were first introduced in SQL Server 2008, but didn't really catch on until SQL Server 2008 R2. The second is SQL Server profiler, which is available to every version of SQL Server starting with at least SQL Server 7 if not older.
Using SQL Server Profiler
SQL Server Profiler is a separate application that lets you view the queries being run on the SQL Server database engine in real time as they complete. It gives you a variety of information about the long running query, including the most important factor -- duration. With SQL Server Profiler, you can filter the data capture, called a trace, so it only includes the required information.
When SQL Server Management Studio is already open, the easiest way to open SQL Profiler is to click on the Tools dropdown menu. Then select "SQL Server Profiler" from the menu. When the application opens, connect to the SQL Server instance that is having the problem. The properties of a new trace will open automatically. Click on the "Event Selection" tab and uncheck everything except for "RPC:Completed" and "SQL:BatchCompleted" (see Figure 1).
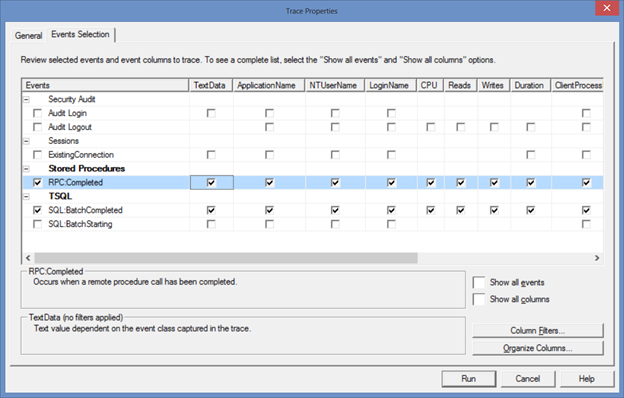 Figure 1. Setting up Trace properties.
This will show you all commands as they complete. You don't want every command though, only the long running commands. So you need to set up a filter. Start by clicking on the "Column Filters" button in the lower right hand corner of Figure 1. The easiest way to filter at this point is to filter based on command duration. After the filter window opens, select the "Duration" option and set a duration filter. The profiler trace will show all queries that take 2.5 seconds or longer to execute (see Figure 2). The duration filter is based on milliseconds, so it has a value of 2,500.
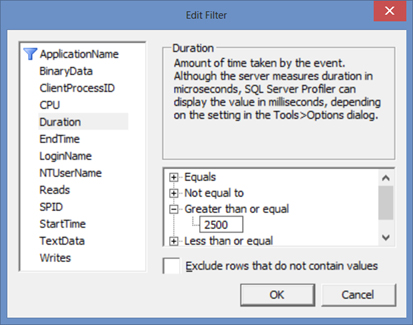 Figure 2. A profiler filter set to 2.5 seconds.
After setting the filter, click OK on the filter window shown in Figure 2. Then click on the Run button shown in Figure 1 and the trace will begin running. As commands complete, they will begin showing in the trace capture window. Once you've identified the long-running queries, you can start the troubleshooting process.
Using Extended Events
Extended Events is a tracing feature built into the SQL Server database engine, starting with SQL Server 2008. It has been enhanced with each later version of the SQL Server database engine since SQL Server 2008. Extended Events has had a slow uptake in usage as there was no user interface available until the release of SQL Server 2012.
You can find Extended Events within SQL Server Management Studio in the Object Explorer. After connecting to the database instance, navigate to the Management folder, then on to Extended Events (see Figure 3).
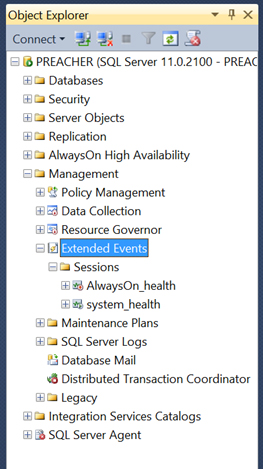 Figure 3. Showing the Extended Events objects within Object Explorer
Right click on the Sessions folder under "Extended Events." This lets you create a new extended event session by selecting "New Session Wizard" from the context menu. As you work through the wizard, you'll be prompted for a name, and whether you wish to have the session run on server startup. Fill these out and continue through the wizard. On the "Choose Template" screen, select "Do not use a template" and click the Next button.
On the page to select which events you wish to capture, search for the word "complete" and locate the rpc_completed and sql_batch_completed events. Move them to the right side using the right arrow button (see Figure 4).
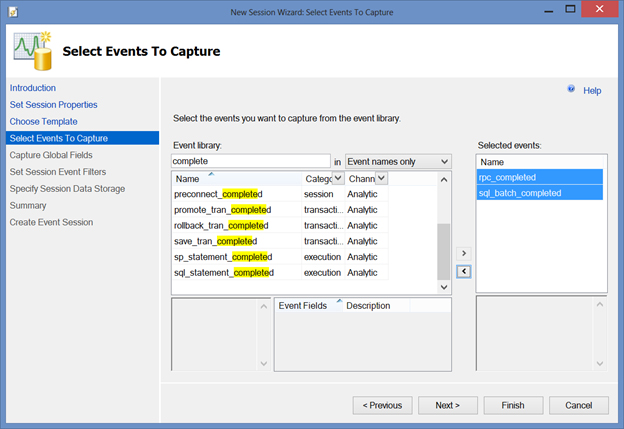 Figure 4. A sample event session.
After selecting the events, the next page will let you view global fields to capture. The important one to capture here is the "sql_text" field, as this is the actual text of the running query. On the session filters page of the wizard, you need to limit the number of commands captured. Do this in a similar way as you did in SQL Server profiler. In the field column, select sqlps.task_execution_time, set the operator to greator_than_unit64 and set the value column to 2500 which is 2.5 seconds (see Figure 5).
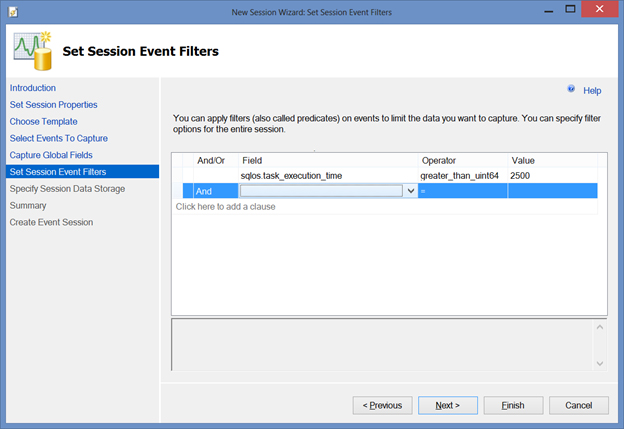 Figure 5. Sample Session Filters to capture queries than take more than 2.5 seconds.
Select the storage location you wish to use, and finish the wizard. Once the wizard is closed, the session should automatically open in a new window. If it doesn't, right click on the session and select "Watch Live Data" from the context menu. This will show you the long running queries on the system. Once you've identified the long-running queries, you can begin troubleshooting.
Find the Problem
Once you've identified a long-running query, you need to find out why. You can assume the query isn't running long because it's being blocked. If the query was being blocked according to sp_who2 or sp_whoisactive, then identify the query that was causing the block, as that's the query to work with first.
The first step is to look at the execution plan for the query and see if there are any glaring problems. Put the query in a new query window in SQL Server Management Studio. Looking at the AdventureWords2012 database (available for download from CodePlex), review the uspGetEmployeeManagers stored procedure execution.
When this stored procedure is executed with a value of 5 for the input parameter, you get an execution plan that could use some tuning (see Figure 6). You can get the execution plan by clicking on the "Include Actual Execution Plan" button from the menu strip or the "Query" dropdown menu, then selecting the "Include Actual Execution Plan" menu option.
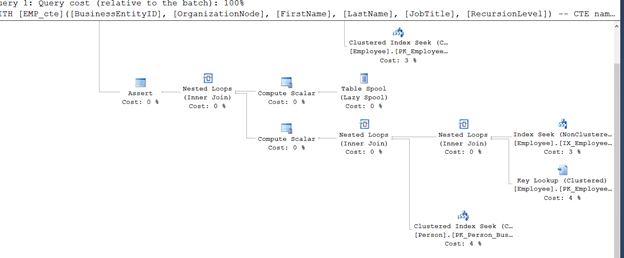 Figure 6. Portion of a sample execution plan.
Key Lookups Looking at the execution plan shown in Figure 6, the first thing that jumps out is the key lookup. You can see this on the far right. This key lookup indicates you need to modify the nonclustered index, which is directly above the key lookup.
In this case, you need to look at the key lookup properties and put any columns returned by the key lookup as included columns of the nonclustered index. By putting your mouse over the Key Lookup icon within the execution plan, you can see the output list shown in Figure 7. When you make this change to the index, the key lookup will be removed from the plan because the columns are returned as part of the nonclustered index lookup.
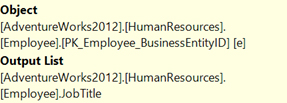 Figure 7. Key Lookup properties.
Over Executing NonClustered Indexes
The next items to look for are index seeks being executed too many times. Put your mouse over the index seeks and look at the "Number of Executions" (see Figure 8).
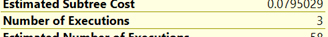 Figure 8. Showing the Number of Executions for a nonclustered index.
Reducing the number of executions of a nonclustered index seek involves looking at the properties of the index seek that is executing too many times. Specifically, look at the "Seek Predicates" section of the properties window (see Figure 9).
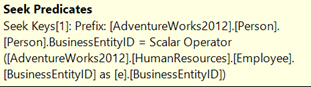 Figure 9. Seek Predicates section of the index scan properties.
Using the "Seek Predicates," you can see the Person table, which this index seek is one, is being fed from the Employee table. If the Employee table is being scanned because there's no proper index on it, adding an index to the Employee table that turns the scan into a seek may reduce the number of executions of the nonclustered index.
Scans into Seeks
Typically, you'll want to get rid of index scan operations by turning them into index seeks. Do this by adding an additional non-clustered index to the table being scanned. By looking at the predicates of the query, you can see the columns upon which you need to create the index.
You can look at the predicates by either looking at the query, or by looking at the properties of the index scan. Looking at the columns within the predicate, the first column in the index should be the most selective column within the table. The next column should be the most selective of the subset of values. This requires knowing the data within the table and how the data will be changing over time.
While these techniques won't solve every performance problem you encounter, they will help you solve a good majority of them. As with everything else in the SQL Server world, there are edge cases that need much more complex tuning techniques. These techniques should help with a large percentage of poorly performing queries though.
About the Author
Denny Cherry is the owner and principal consultant for Denny Cherry & Associates Consulting and has over a decade of experience working with platforms such as Microsoft SQL Server, Hyper-V, vSphere and Enterprise Storage solutions. Denny's areas of technical expertise include system architecture, performance tuning, security, replication and troubleshooting. Denny currently holds several of the Microsoft Certifications related to SQL Server for versions 2000 through 2008 including the Microsoft Certified Master as well as being a Microsoft MVP for several years. Denny has written several books and dozens of technical articles on SQL Server management and how SQL Server integrates with various other technologies.